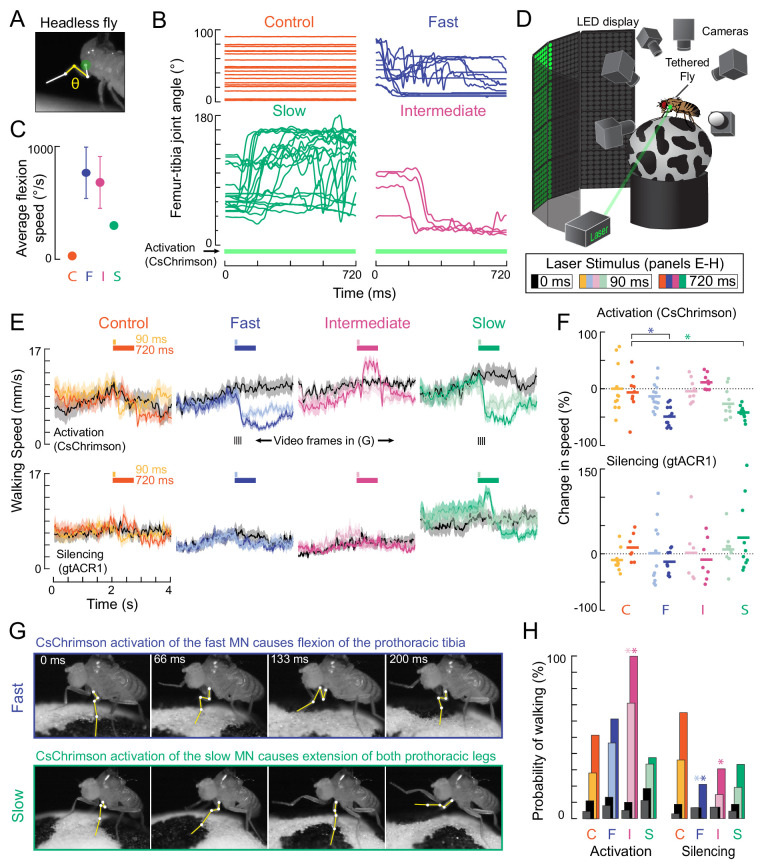
Figure 7. Optogenetic perturbation of motor neurons in behaving flies.
(A) Example frame illustrating behavioral effects of optogenetically activating leg motor neurons in headless flies. A green laser (530 nm) is focused at the coxa-body joint of the fly’s left front leg (outlined in white) and the femur-tibia joint (yellow) is monitored with high-speed video. (B) Example traces of femur-tibia joint angles during optogenetic activation (Gal4 >CsChrimson) of each motor neuron type in headless flies. The control line has the same genetic background as motor neuron lines but lacks Gal4 expression (BDP-Gal4 >CsChrimson).( C) Average (± sem) tibia flexion speed during the first 300 ms of CsChrimson activation (n = 5 flies of each genotype). (D) Schematic of the behavioral setup, in which a tethered fly walks on a spherical treadmill. The treadmill and fly are tracked with separate cameras. As in A), a green laser is focused on the coxa of the left front leg. (E) Average treadmill forward velocity (± sem) of walking flies, when activating (top row) or silencing (bottom row) control (n = 11, 13), fast (n = 15, 14), intermediate (n = 9,12), or slow (n = 11, 13) motor neurons for 90 ms (dark colors) or 720 ms (light colors). Black traces indicate trials with no laser (0 ms). Gray boxes indicate the period of optogenetic stimulation. Black dashes above fast and slow flexor activation traces indicate the time points in panel G. (F) Percent change (change in speed/pre-stimulus speed) in the average running speed of flies shown in C during stimulation+200 ms for activation (top) and silencing (bottom). Asterisks indicate p<0.01 relative to control (bootstrapping with false discovery rate correction; see methods for details). (G) Example frames showing representative behavioral responses of running flies during the first 200 ms of fast (top) and slow (bottom) MN activation. (H) Probability that a stationary fly initiated a walking bout during the 500 ms following either MN activation (left) or silencing (right). Dark colors are for the 90 ms stimulus (or no stimulus – black) and light colors are for the 720 ms stimulus (or no stimulus – gray). Asterisks indicate p<0.01 relative to control (bootstrapping with false discovery rate correction; see Methods for details).


