. 2020 Jun 8;9:e57093. doi: 10.7554/eLife.57093

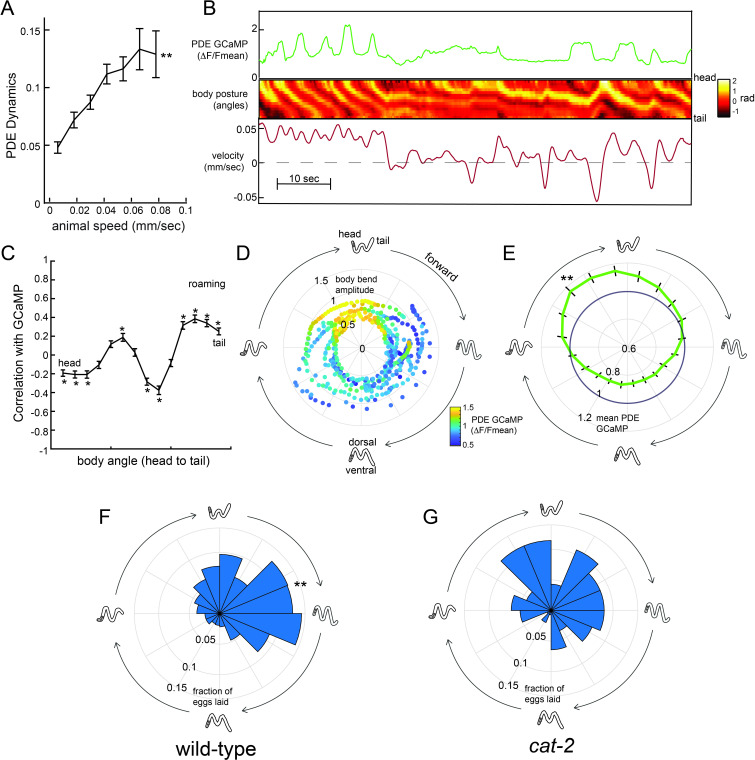
Figure 6. Dopaminergic PDE neurons display activity patterns phase-locked to egg-laying during roaming.

(A) PDE dynamics increase with animal speed. PDE dynamics here is defined as the absolute value of the time derivative of the PDE GCaMP signal. **p<0.001, empirical bootstrap test. (B) Example dataset from a wild-type animal, showing PDE::GCaMP6m signal, body posture (shown as body angles, from head to tail), and animal velocity. (C) Correlation coefficient of PDE activity with each of the 14 body angles. *p<0.05, empirical bootstrap test (Bonferroni-corrected). (D) Example dataset showing how PDE activity (indicated by color) changes as animals proceed through stereotyped forward propagating bends during roaming. Theta values on the polar plot correspond to the phase of the forward propagating bend; radius corresponds to the depth of the body bends (which was quantified as the standard deviation of the mean-subtracted body angles). Corresponding body postures and the direction of the trajectories during forward movement are indicated. Note that PDE activity reliably increases during a specific phase of the forward propagating bend. (E) Average PDE activity at different phases of the forward propagating bend. Theta values are defined as in (D) and the radius indicates the mean PDE GCaMP signal. **p<0.001, Mann-Whitney U test. (F) Histogram depicting frequency of egg-laying events for wild-type animals at different phases during the forward-propagating bend. **p<0.001, Rayleigh z test. (G) Histogram depicting frequency of egg-laying events for cat-2 mutants at different phases during the forward-propagating bend. *p<0.05 versus wild-type, Fisher’s exact test. For (A), (C), and (E), n = 39 animals and data are shown as means ± SEM. For (F) and (G), n = 30 and 10 animals, respectively.

Figure 6.

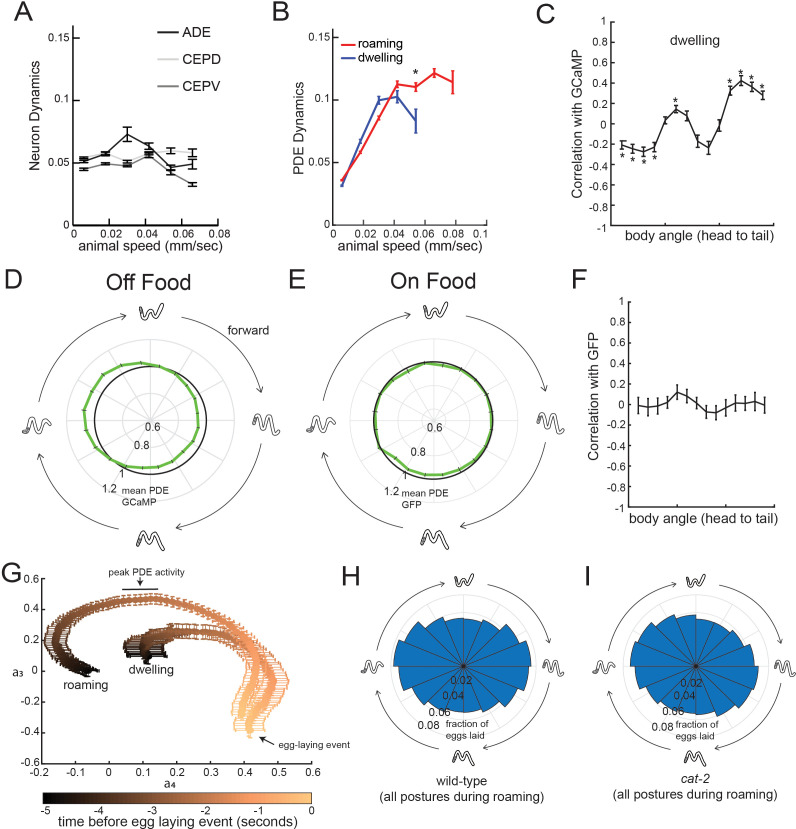
Figure 6—figure supplement 1. Additional analyses related to PDE activity and egg-laying.

Figure 6—figure supplement 1.

(A) Dynamics of ADE, CEPD, and CEPV do not vary with animal speed. Dynamics here is defined as the absolute value of the time derivative of the GCaMP signal for each neuron. n = 22–28 animals per condition. (B) Average PDE calcium dynamics for animals traveling at different speeds in different states. Calcium dynamics are defined here as the absolute value of the time derivative of the GCaMP signal. N = 39 animals. *p<0.001, roaming versus dwelling, Mann-Whitney U test. (C) Correlation between each of the body angles and PDE activity during dwelling states. N = 39 animals. *p<0.05, empirical bootstrap test (Bonferroni-corrected). (D) Average PDE GCaMP activity during forward-propagating bends for animals recorded in the absence of food. There is significantly reduced activity at the peak phase relative to animals on food (p<0.05, Mann-Whitney U test). n = 56 animals off food and n = 39 animals on food. (E) Average PDE GFP signal during forward-propagating bends for animals recorded in the presence of food. Compare to actual PDE::GCaMP signal in Figure 6E. n = 12. (F) Average correlations of PDE::GFP signal with body curvature. Compare to actual PDE::GCaMP signal in Figure 6C. n = 12. (G) Average postural changes for the five seconds that precede egg-laying events in roaming versus dwelling states. Data are shown as average trajectories through PCA space, where the two axes are the projection amplitudes of the third and fourth eigenworms (see Figure 1F for full 2D histograms; the third and fourth eigenworms are most relevant to undulatory locomotion). Note that the posture trajectories differ in the seconds preceding egg-laying, even though they converge to be almost the same at the moment of egg-laying. n = 30 animals. (H) Histogram depicting phases of the propagating forward bend that wild-type animals display overall, shown as same format as in Figure 6G–H. n = 30 animals. (I) Histogram depicting phases of the propagating forward bend that cat-2 mutants display overall. Note that there is no significant difference between wild-type and cat-2. n = 10 animals. For (A–G), data are shown as means ± SEM.