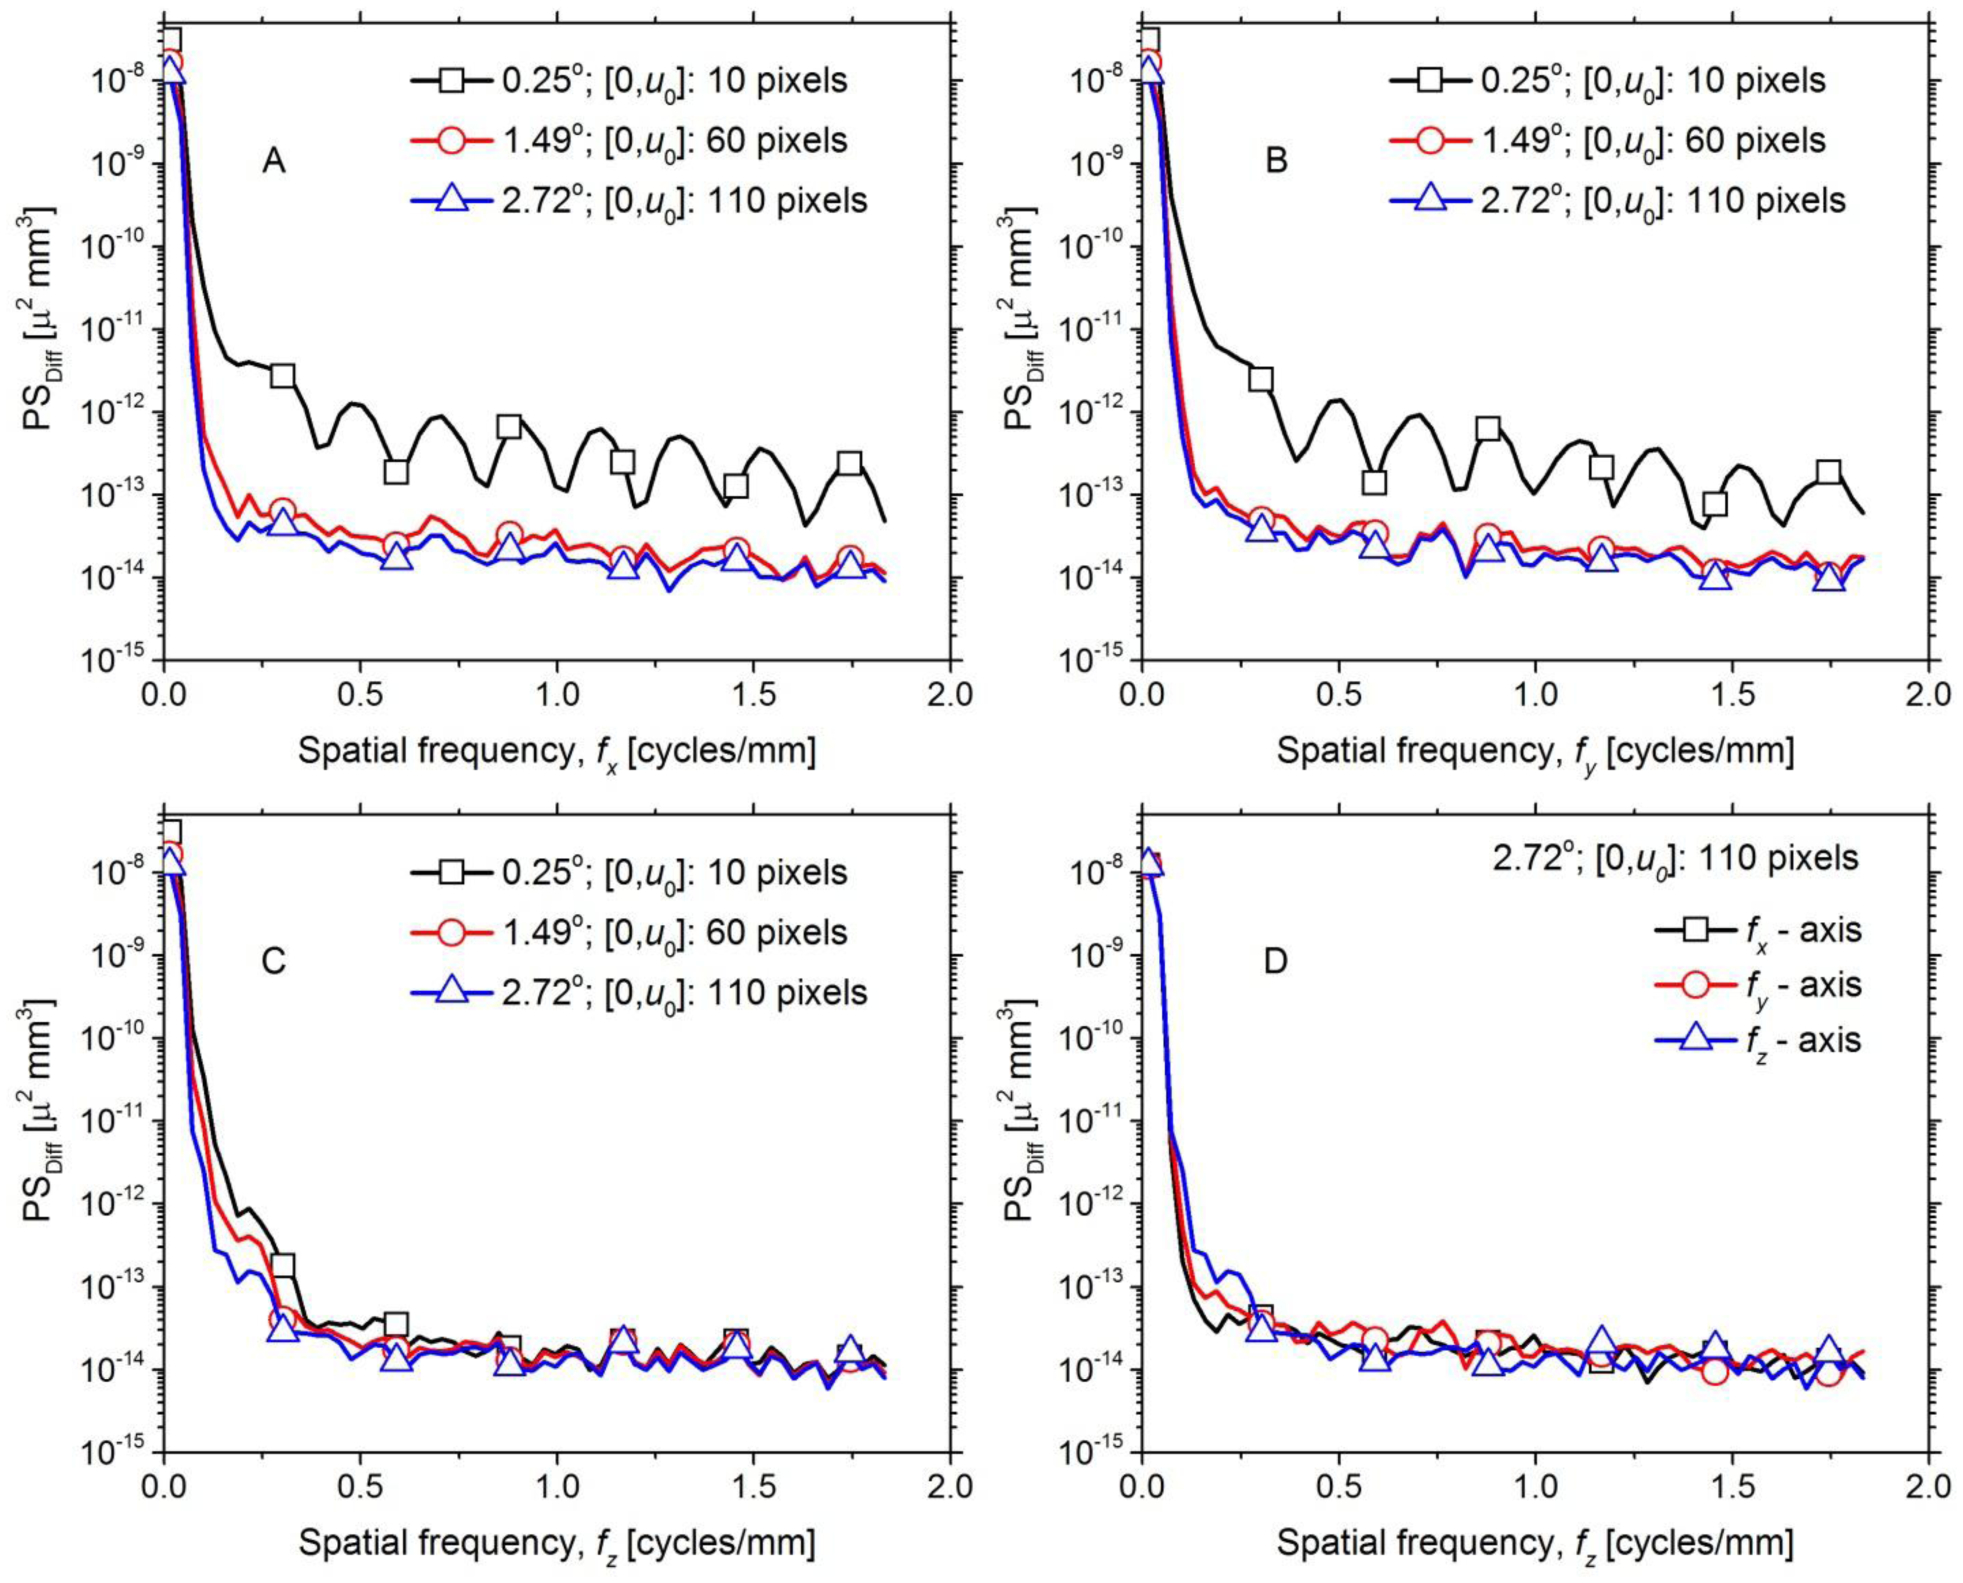
Fig. 13.

The 1-D PSDiff along the 3 orthogonal spatial frequency axes extracted from the 3-D PSDiff are shown. A through C provide the 1-D PSDiff along fx, fy and fz, respectively and within each panel the plots correspond to the 3 Δθ values investigated. Panel D compares the 1-D PSDiff along the 3 orthogonal spatial frequency axes for Δθ = 2.72° that corresponds to half-overlap region of [0,u0] = 110 pixels.
