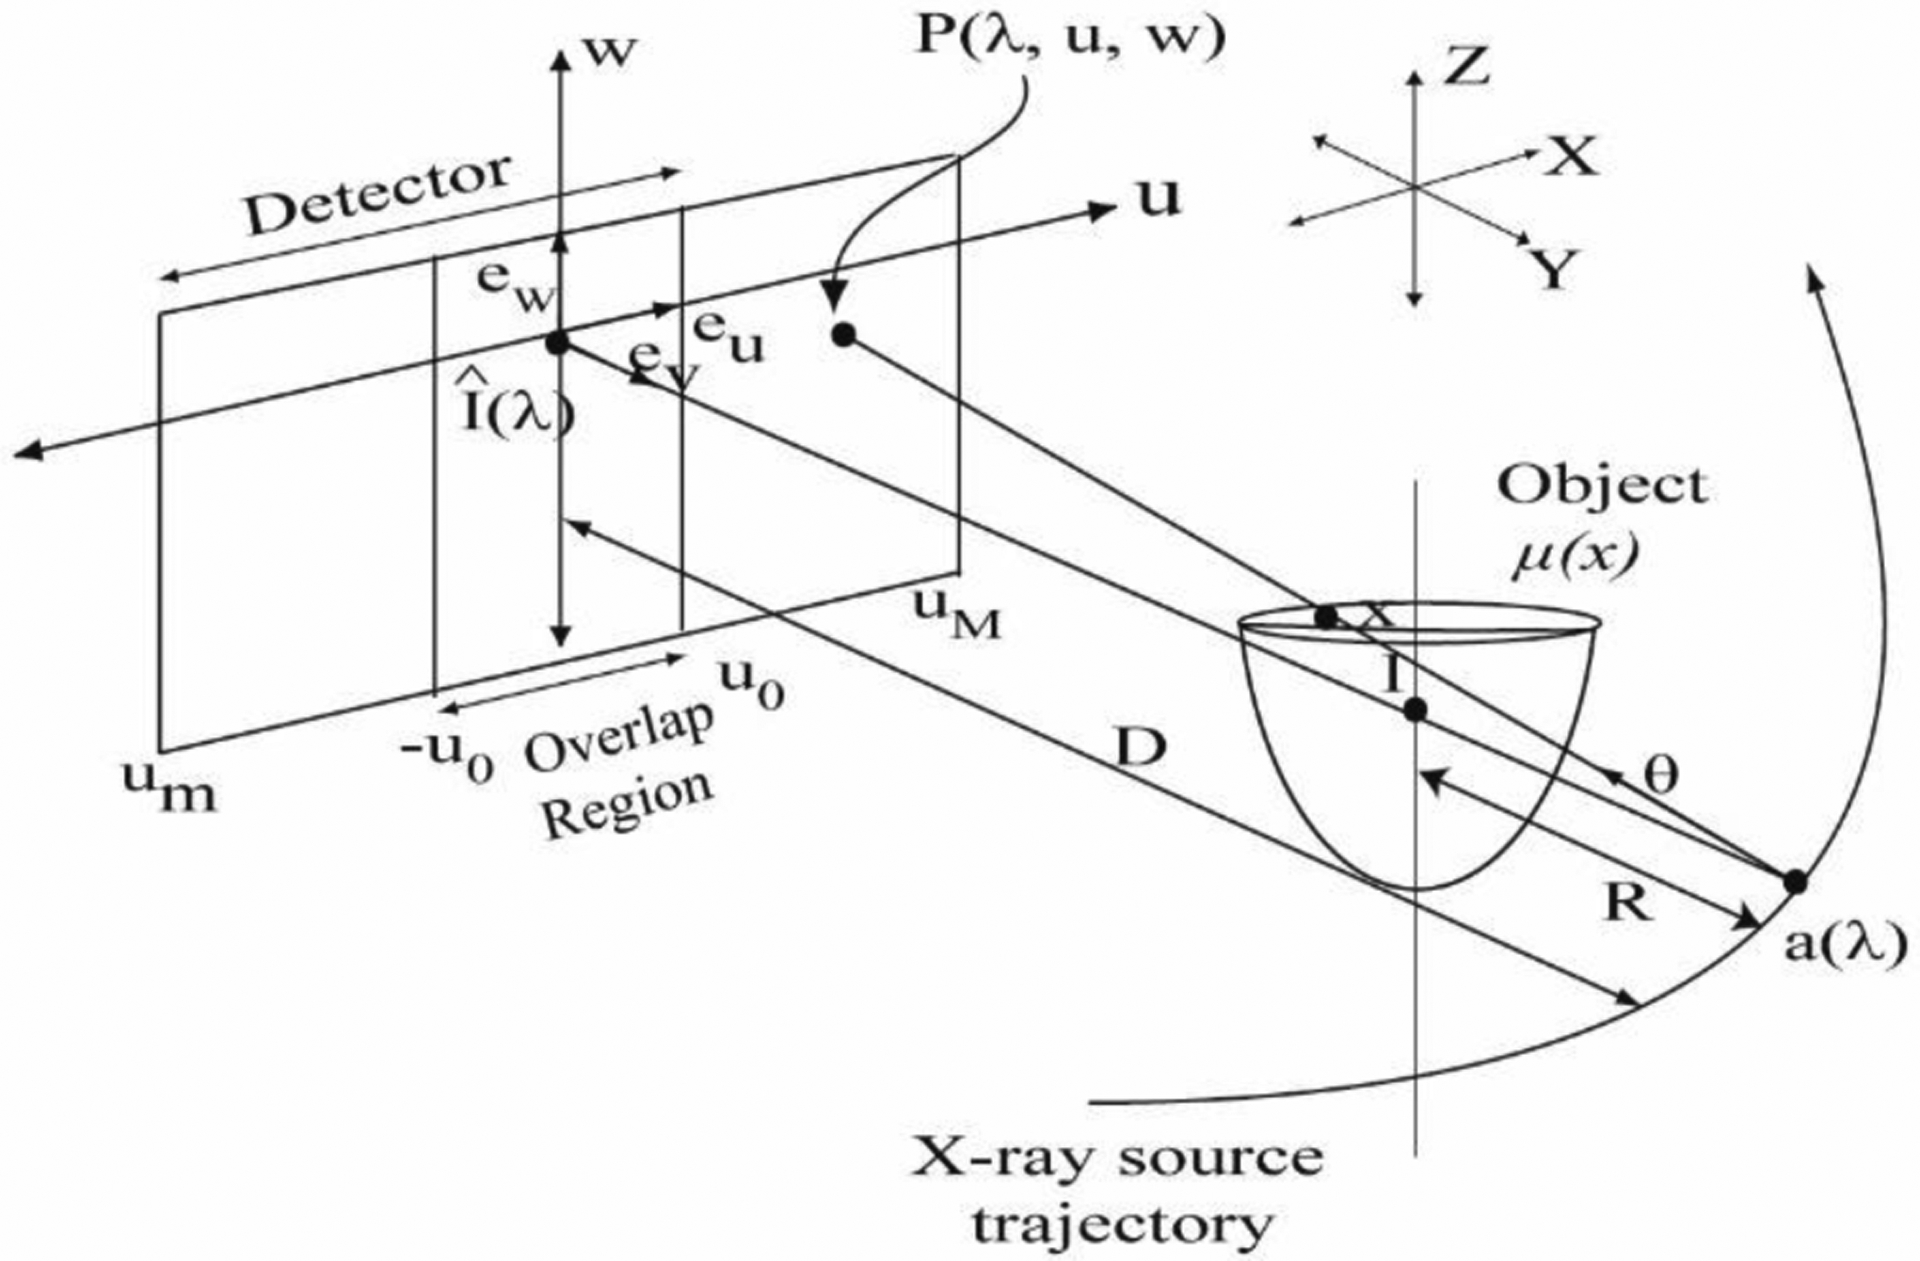
Fig. 2.

Schematic of the cone-beam data acquisition geometry using laterally-shifted detector that illustrates the symbols used in the text. The three-dimensional (3D) set of object attenuation coefficients to be reconstructed are denoted by μ(x) and the detector coordinates are denoted as (u, w). Conjugate views provide an overlap region [−u0,u0]. The drawing is not up to scale.
