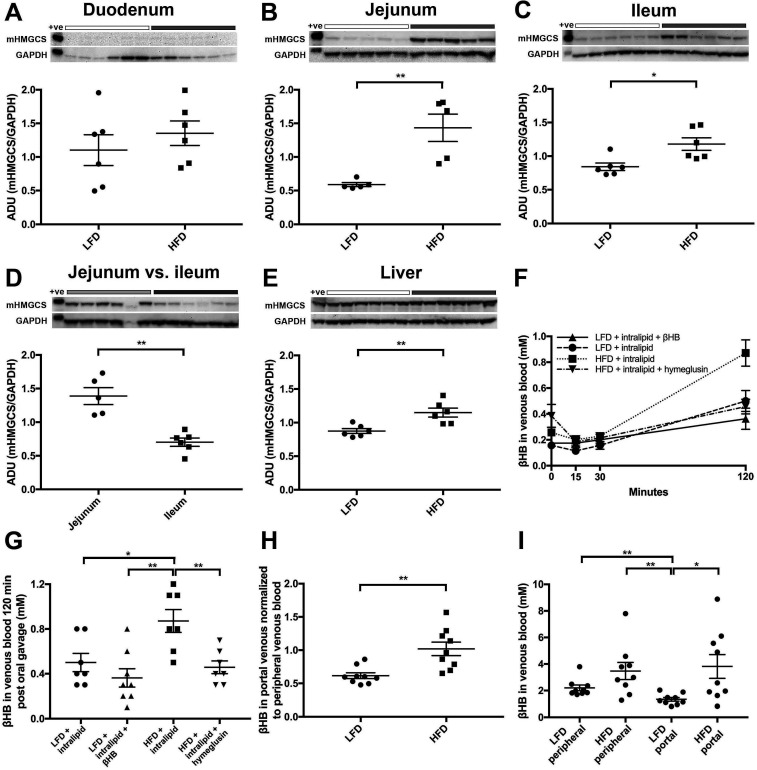
Figure 3.
Western blot analyses of the effects of low-fat diet (LFD; white bars above blots) versus high-fat diet (HFD; grey bars above blots) on mHMGCS protein expression. Upper panels show mHMGCS expression in (A) duodenum, (B) jejunum, (C) ileum, (D) jejunum versus ileum and (E) liver in C57BL/6J mice on LFD or HFD. GAPDH was used as loading control and is shown below each corresponding mHMGCS band. Lower panels show the corresponding densitometric quantifications of mHMGCS versus GAPDH. Note that (D) shows comparison of mHMGCS in the jejunum (light grey BAR) vs ileum (dark grey BAR) in HFD fed mice to demonstrate the difference in expression levels between jejunum and ileum. (F) Measurement of βHB at 0, 15, 30 and 120 min in venous blood of mice fed LFD or HFD for 3 months. prior to the experiment the mice were given an oral fat load (250 µL of intralipid) in order to supply substrate for ketogenesis. In some mice the oral fat load was mixed with βHB, or the mHMGCS-inhibitor hymeglusin, as indicated. (G) shows the measurements from (F) at 120 min in a scatter plot (n=7–8). βHB levels in venous blood were significantly higher in the HFD mice 120 min after oral gavage compared with LFD mice. Notably, the βHB levels in HFD mice pretreated with the mHMGCS-inhibitor hymeglusin did not increase. (H) Mice fed HFD for 3 weeks had significantly higher levels of ketone bodies in portal vein blood normalised to ketone bodies in peripheral blood, in contrast to mice fed LFD (n=9) after oral gavage with Intralipid (500 µL). (I) Absolute levels of ketone bodies (mM) in peripheral and portal blood in the same mice as in panel H (n=9). Statistical analyses were performed using Mann-Whitney U test. *p<0.05 and **p<0.01. +ve; positive control; ADU, arbitrary densitometric units; GAPDH, glyceraldehyde-3-phosphate dehydrogenase; mHMGCS, mitochondrial 3-hydroxy-3-methylglutaryl-CoA synthase.

