
Figure 2: Blockade of fructose metabolism is sufficient to prevent sugar-induced metabolic syndrome.
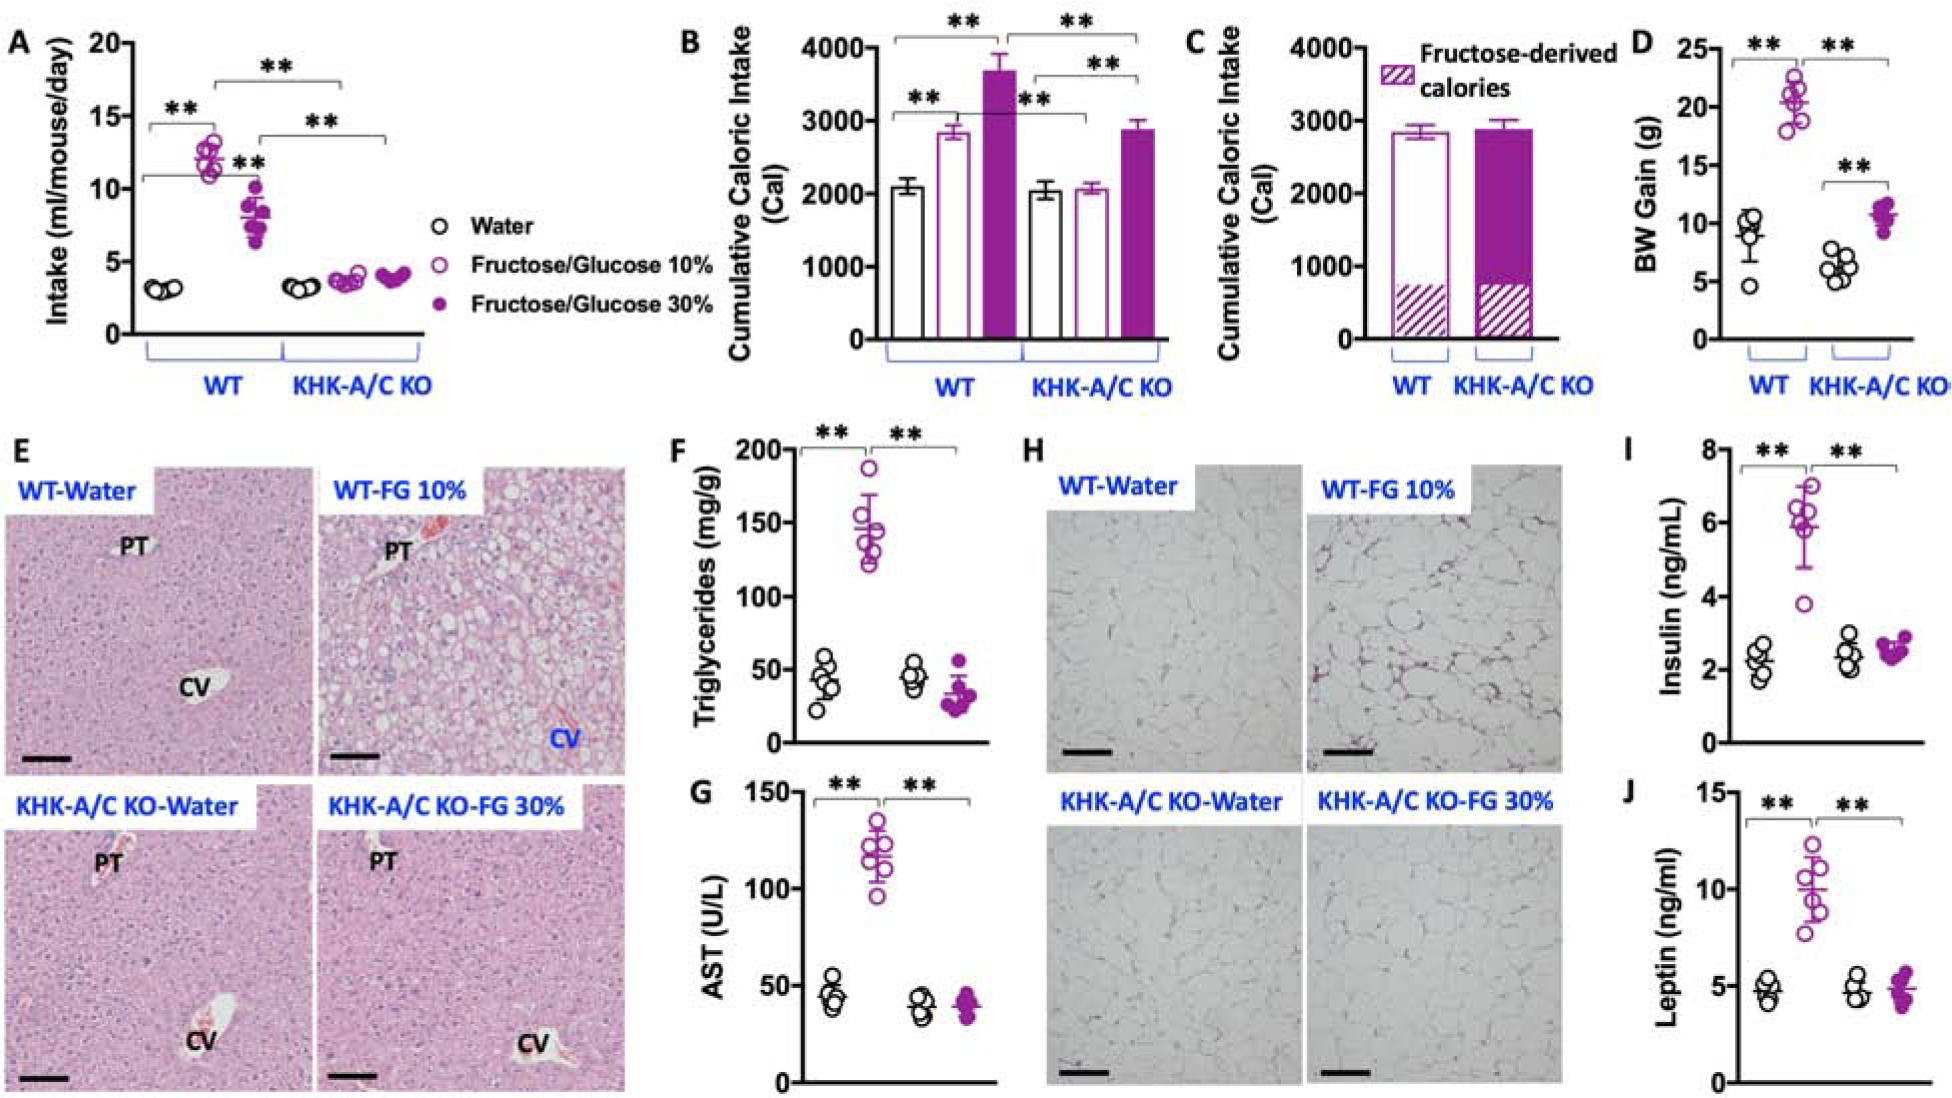
A) 30-week average intake of water (black), 10 % fructose/glucose (FG) solution (purple, clear symbols) or 30 % FG solution (purple, solid symbols) in wild type and KHK-A/C KO mice.
B) 30-week cumulative caloric intake in same groups as A).
C) 30-week cumulative caloric intake and fructose-derived calories in WT mice exposed to 10% FG and KHK-A/C KO mice exposed to 30 % FG.
D) 30-week body weight gain in WT and KHK-A/C KO mice exposed to water, 10% FG (wild type) or 30% FG (KHK-A/C KO).
E) Representative H&E images from livers of mice (n > 10 images per animal) of the same groups as in D). Size bars: 50 μM, PT: Portal triad; CV: Central Vein
F–G) Hepatic triglycerides and plasma AST levels in the same groups as in D).
H) Representative H&E images from epididymal adipose tissue of mice (n > 10 images per animal) of the same groups as in D). Size bars: 50 μM
I–J) Fasting plasma insulin and leptin levels in the same groups as in D).
The data in A–D), F–G) and I–J) were presented as the means ± SEM and analyzed by One Way ANOVA with Tukey post hoc analysis. *P < 0.05, **P < 0.01, n = 6 mice per group. See also Supplemental Table 1