
Figure 2. Prolonged HFD feeding causes differential expression of various genes in individual cell types of the ARC.
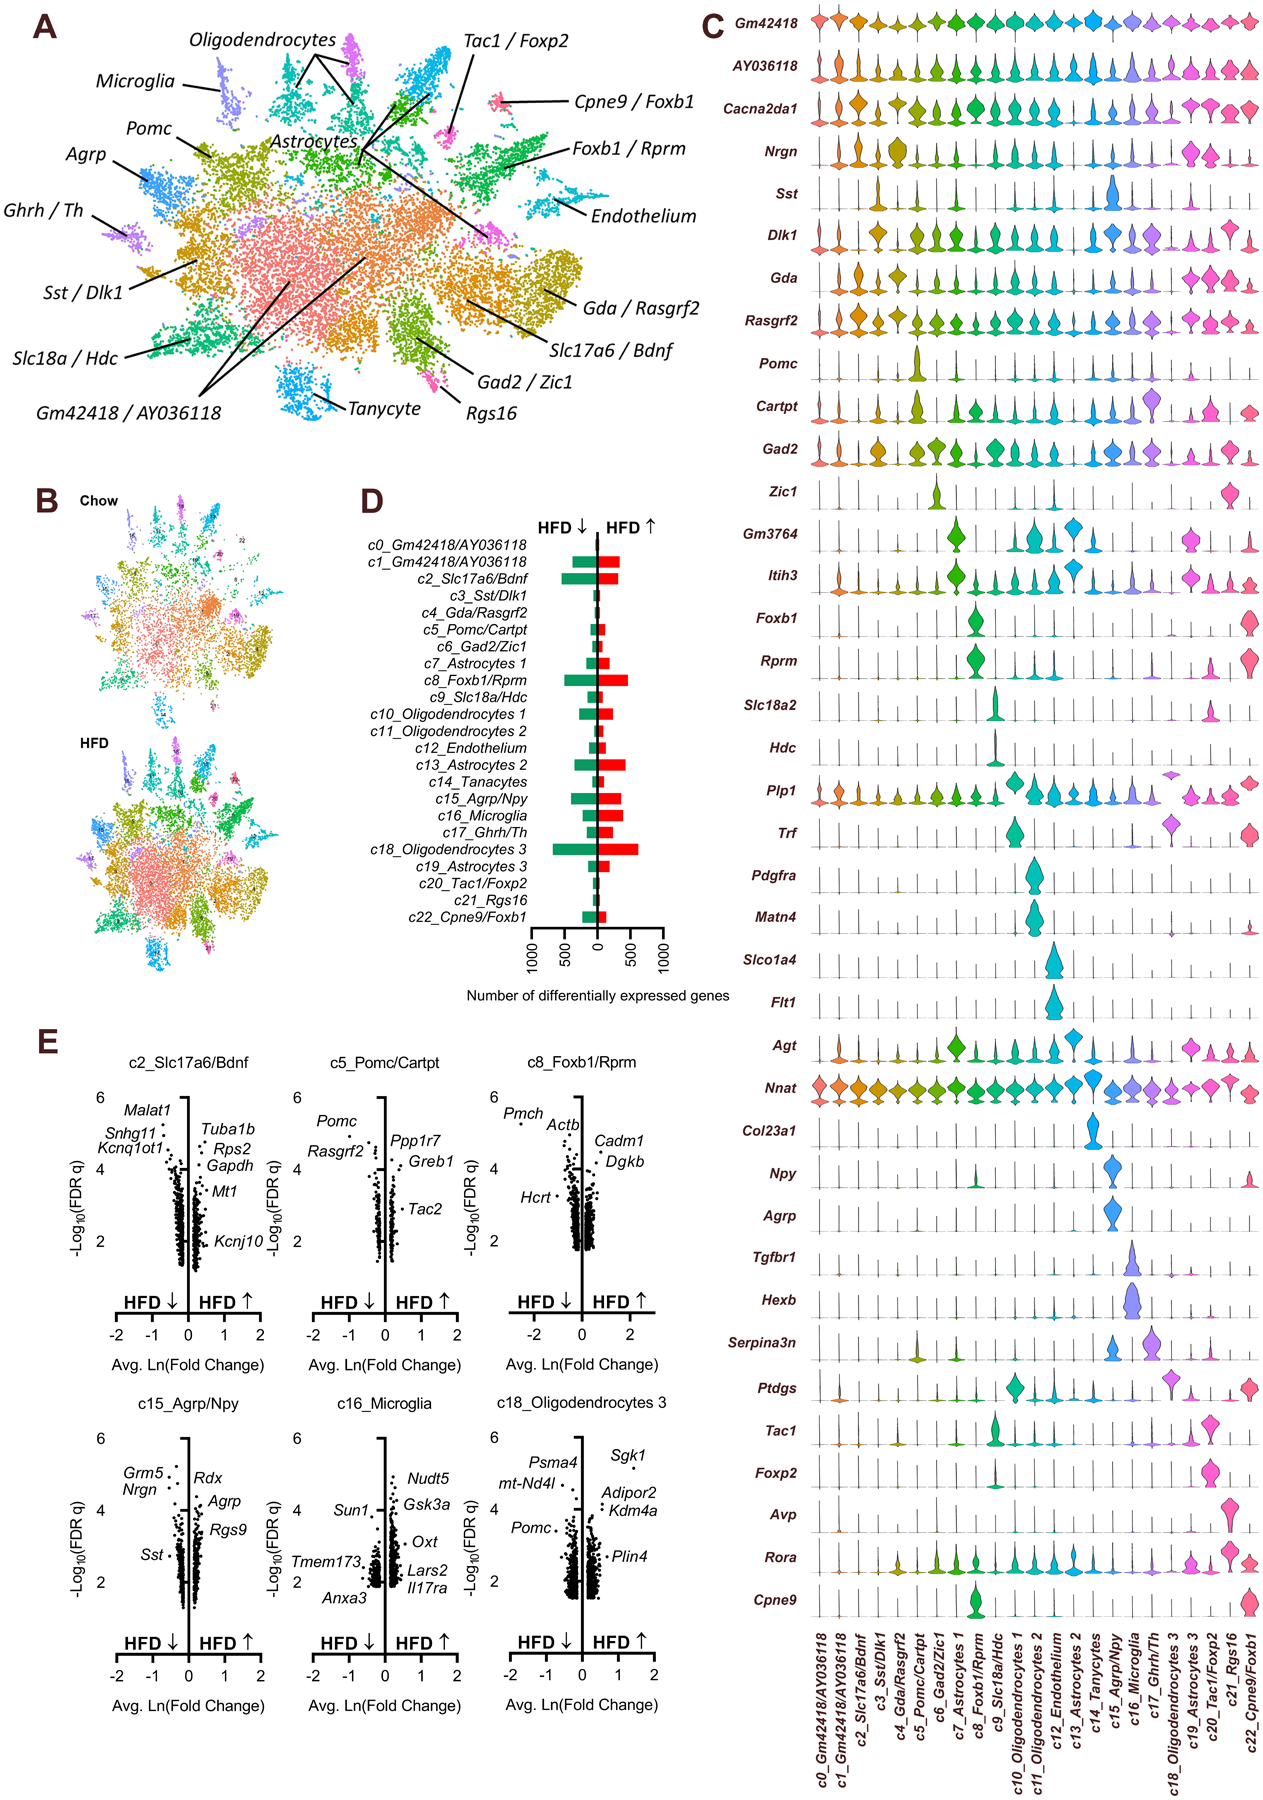
(A) t-distributed stochastic neighbor embedding (TSNE) plot of cell clusters, identified by Seurat. (B) TSNE plot of cell clusters, split by diet. (C) Expression of top genes that uniquely identify individual clusters. (D) Differential gene expression counts, HFD vs Chow, by cluster. (E) Volcano plots of differentially-expressed genes, HFD vs Chow, in selected clusters. Related information also included in Tables S1–S3 and Figures S1–S2.