
Figure 1: HDX-MS reveals regions with differential solvent accessibility dependent on intact receptor.
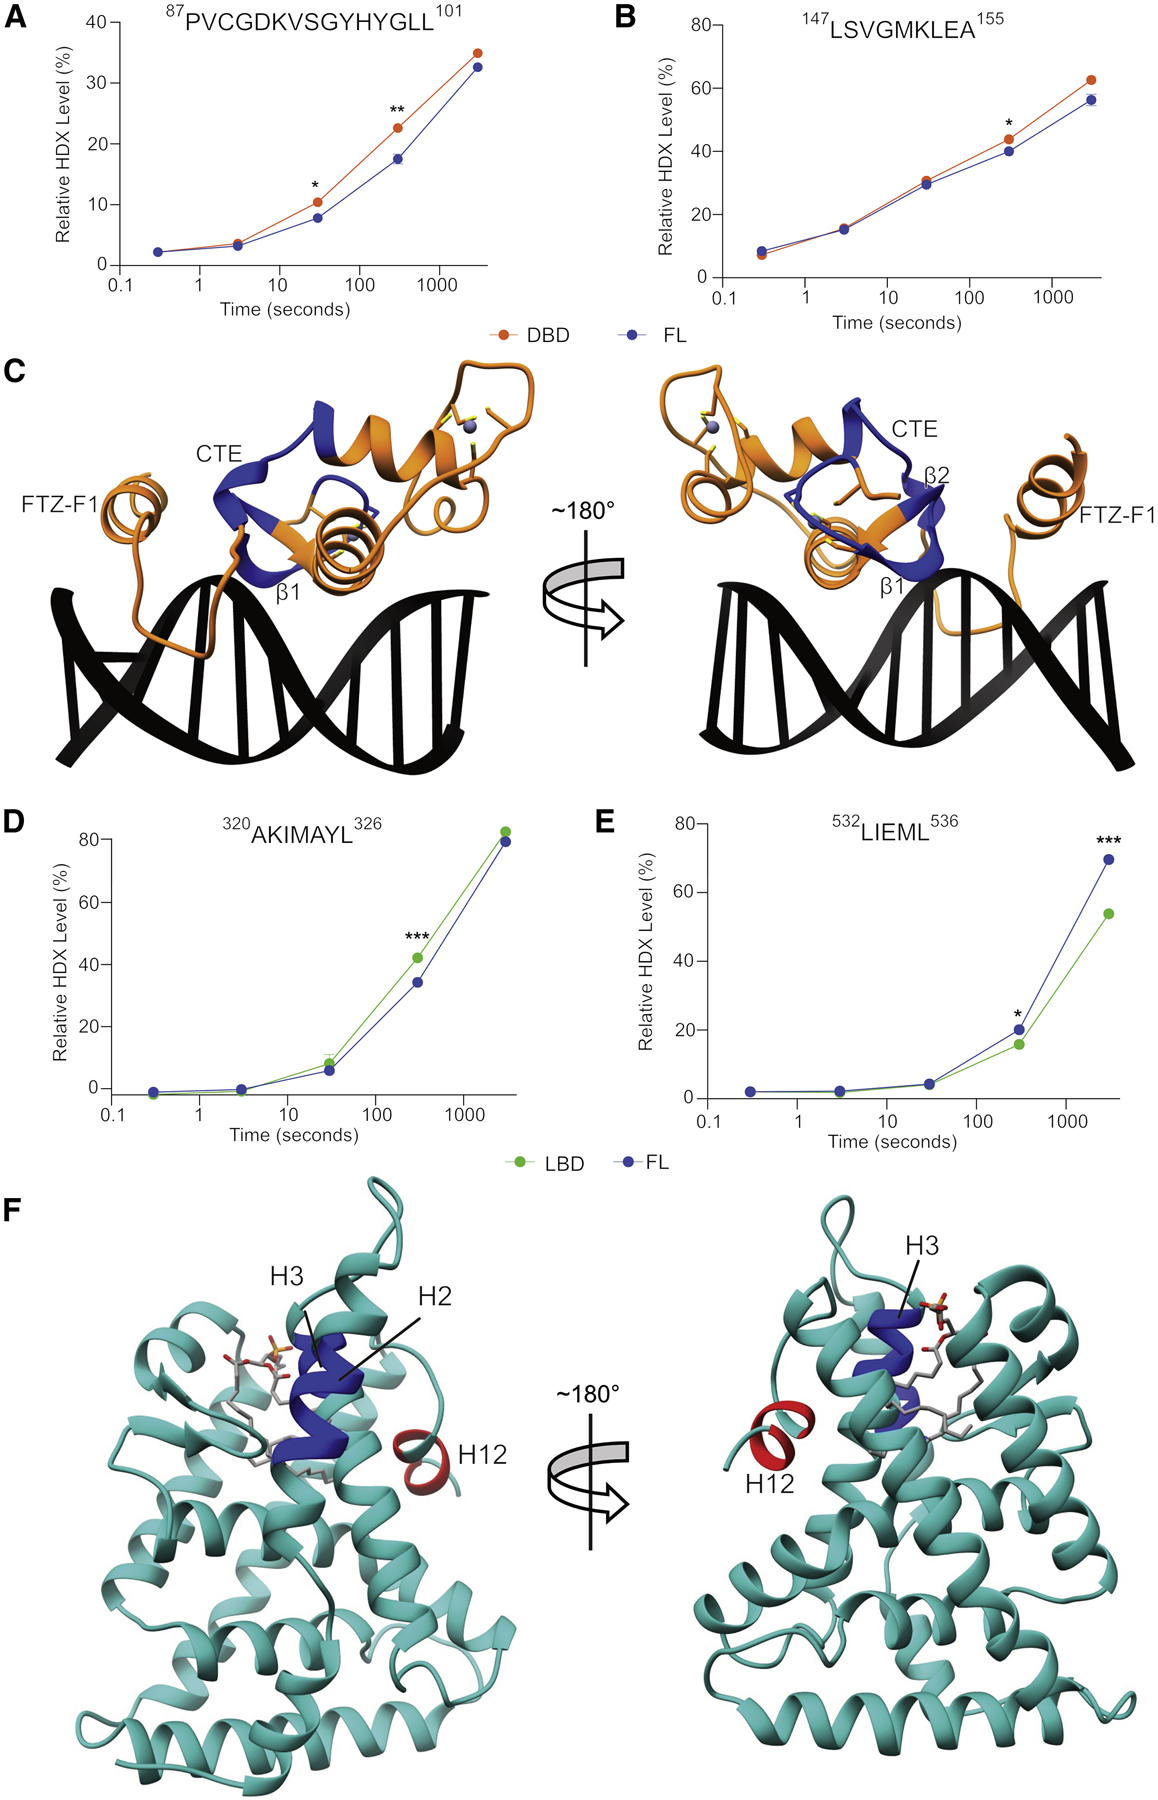
HDX profiles for peptides shown to have differential solvent exchange between LRH-1FL and the DBD (A, B) or the LBD (D,E). Regions with altered solvent accessibility mapped onto crystal structures of the DBD (C) (PDB: 2A66) and LBD (F) (PDB: 1YOK with modeled H2/3 linker). Decreases in HDX are depicted as blue and increases are depicted as red. Data represent mean ± SD from three independent experiments. *P<0.01, **P<0.001, ***P<0.0001.