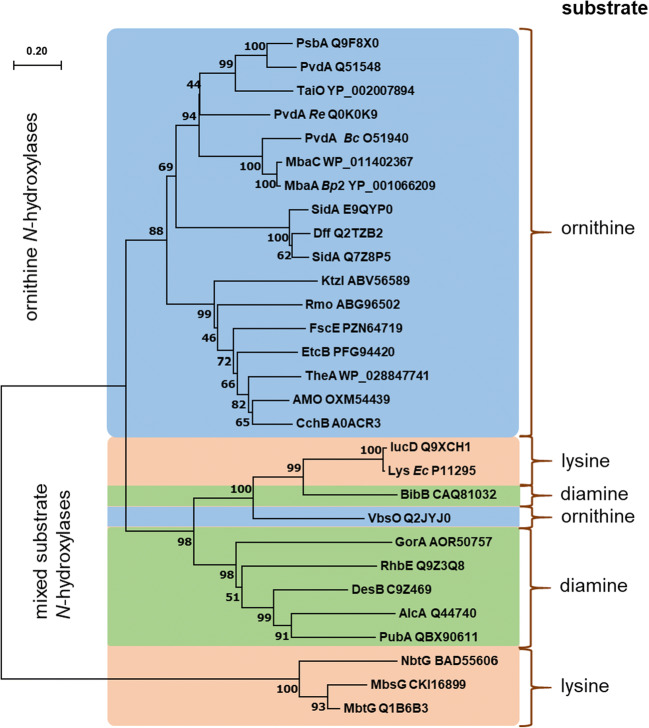
Fig. 4.
Minimum evolution distance tree of N-hydroxylating flavoprotein monooxygenases from bacteria and fungi in analogy to earlier studies (Franke et al. 2013; Esuola et al. 2016). Evolutionary distances were computed using the JTT matrix–based method and are given in the units of the number of amino acid substitutions per site (see scale bar). The accession numbers and protein designations are given according to Table 1 and references cited therein. It is worth to mention the most intensively studied representatives: Aspergillus fumigatus SidA (E9QYP0) and Pseudomonas aeruginosa PvdA (Q51548), respectively. The substrate of each NMO is given and respective parts of the tree are color-coded

