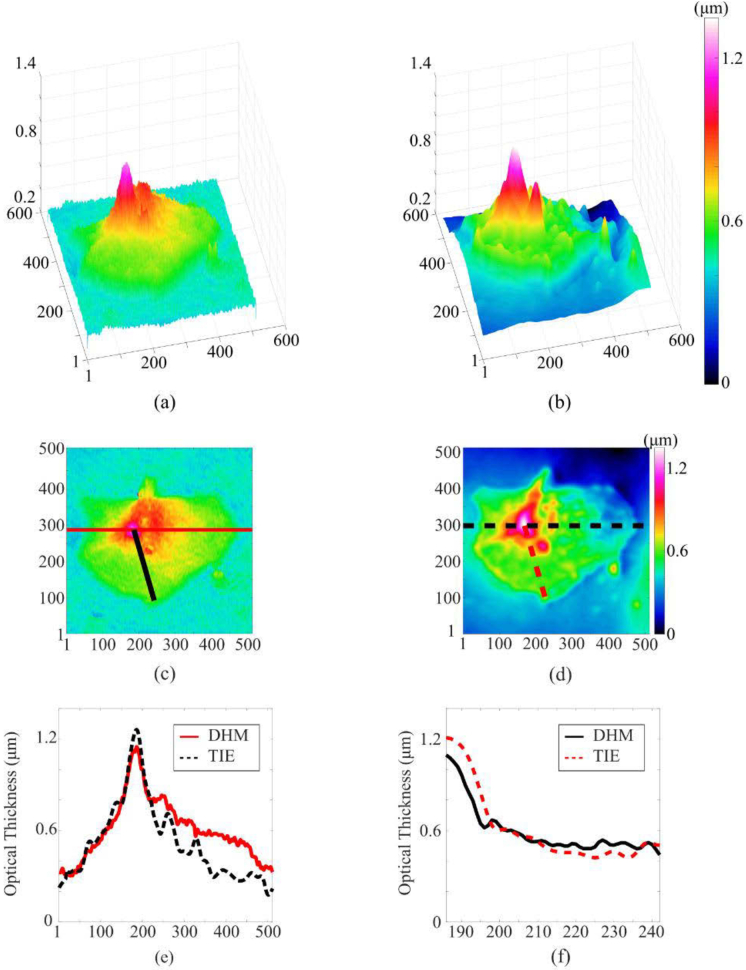
Fig. 5.
Comparison of a cheek cell optical thickness measurements using DHM (left-hand side) and TIE (right-hand side). The images in (a) and (b) show the off-axis view; (c) and (d) show on-axis view. Vertical axis represents optical thickness. The scale for the horizontal (x and y) axes is in pixels (pixel size is 0.17×0.17 µm2). The cross-section shown as the red solid horizontal line in (c) and the black dashed horizontal line in (d) is plotted in (e), and the cross-section shown as the black solid diagonal line in (c) and the red dashed diagonal line in (d) is plotted in (f).

