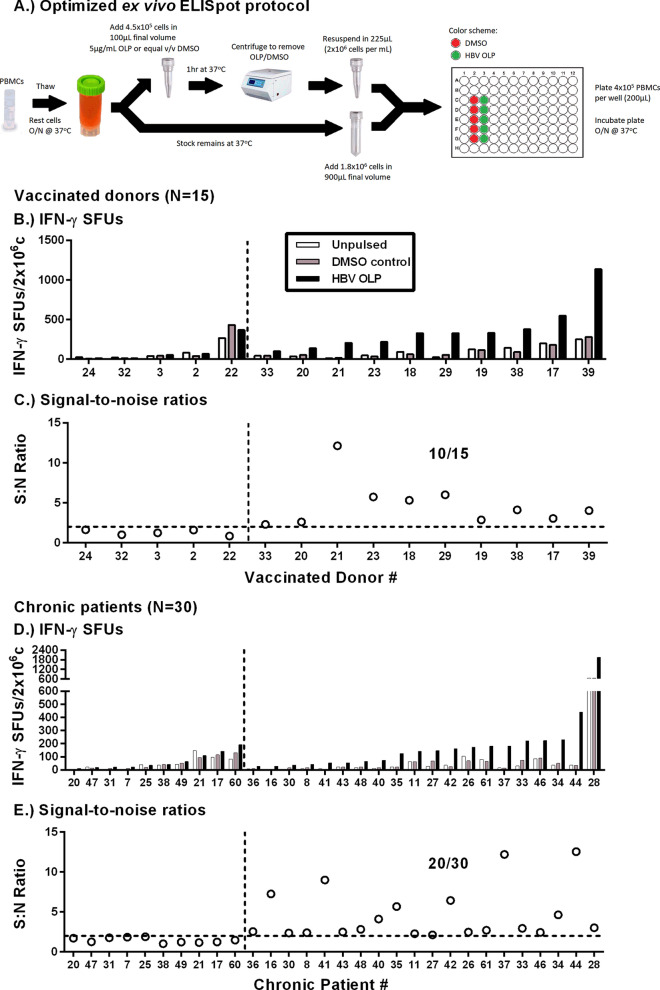
Figure 2.
67% of chronic patients had detectable HBV-specific T cells ex vivo. (A) Schematic of the optimized peptide pulsing and ELIspot plating strategy. The same peptide pulsing and plating strategy was used for the Fluorospot assay and single OLP pool stimulations to determine antigen-specificity (i.e. Figs. 1D, 6B). (B) Absolute SFU and (C) S:N ratios of 15 vaccinated donors tested with ex vivo IFN-γ ELISpot. (D) Absolute SFU and (E) S:N ratios of 30 CHB patients. To the left of the vertical dotted lines are non-responders. To the right are ELISpot-positive responders. Horizontal dotted lines indicate the positive S:N ratio threshold of 2.

