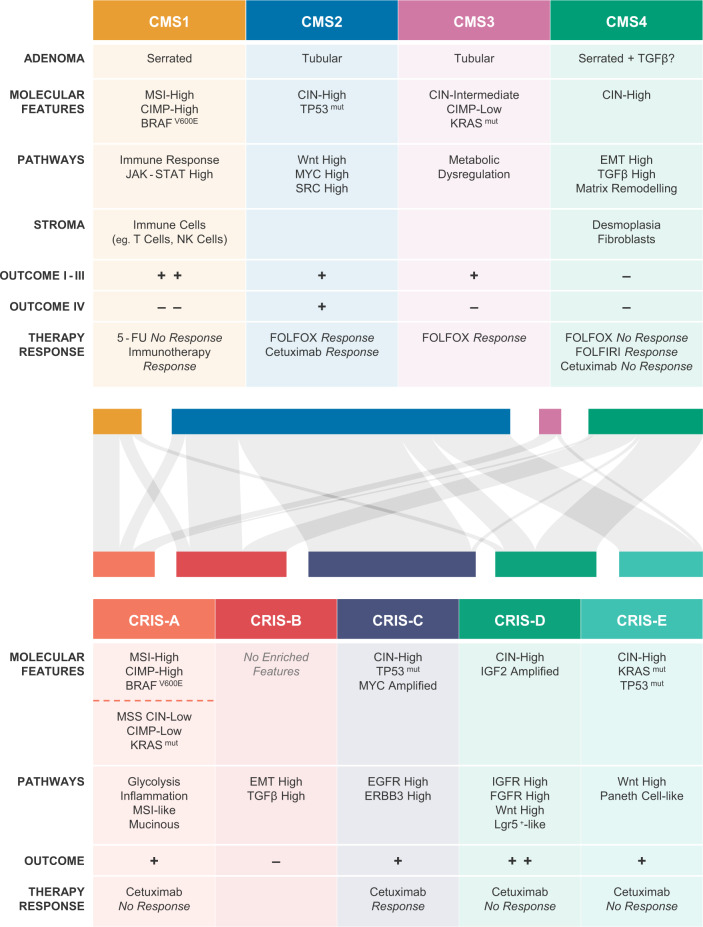
Fig. 1. Key characteristics of CMS and CRIS subtypes and their inter relatedness.
Defining features of the CMS (top) and CRIS (bottom) subtypes are summarised in the respective tables. The relationship between classification systems is illustrated by the Sankey diagram in the middle. A total of 119 established cell lines (N = 91) and primary cell and organoid cultures (N = 28) could be assigned with high confidence using both classifiers89,90. Colours of nodes correspond to the respective CMS and CRIS subtypes in the tables, size of the nodes reflects the number of cultures adhering to that particular subtype. For comparison with patient CMS–CRIS distribution, please refer to the publication of Isella et al.89.

