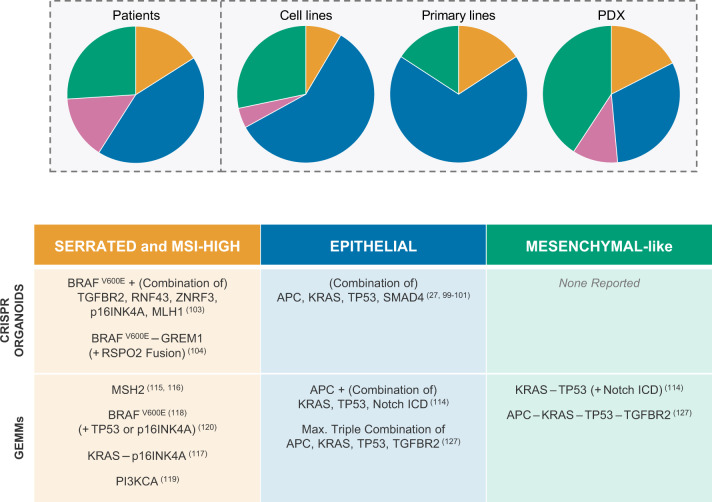
Fig. 2. CMS subtypes in preclinical models.
Top: Pie charts illustrating distribution of CMS subtypes in different preclinical models compared to distribution amongst patients as reported in Guinney et al.73. Classifier used for cell lines is the support vector machine classifier developed and trained as described in Linnekamp, van Hooff et al.91. Datasets used for cell lines: GSE36133, GSE100478, GSE59857 and GSE68950. Datasets for primary cell lines: GSE100549 and GSE100479 supplemented with additional primary spheroid culture gene expression profiles generated by RNAseq in the laboratory of Prof. Dr. Giorgio Stassi in Palermo (unpublished data). (Primary) cell lines were allocated to a certain CMS class using the following rules: (i) consistent CMS class prediction across all datasets with probability score >0.4. (ii) Consistent CMS class prediction across all datasets with probability score >0.5 in 33% of datasets and >0.35 in all other datasets. (iii) Probability score >0.5 for one consistent CMS class in 66% of the datasets. CMS class prediction in other datasets could differ from majority, but with probability score <0.5. (iv) Probability score cut-off was set to >0.5 if cell line was present in a single dataset. PDX classification and distribution obtained from and implemented according to Prasetyanti et al.95. Bottom: Overview of reported CRISPR-edited organoids and genetically engineered mouse models that reflect distinct biology of human adenomas and colon carcinomas. Numbers in between parentheses refer to original publication.

