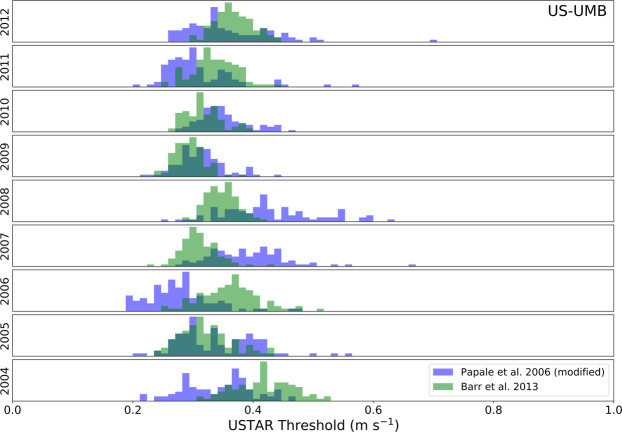
Fig. 4.
Example of the distribution of USTAR thresholds calculated for each year using the MP30 method in blue and CP41 method in green for the US-UMB site (dark green where they overlap). All these thresholds were pulled together to extract the CUT final 40 thresholds, while for the VUT thresholds, each year was pulled with the two immediately before and after (e.g., 2005 + 2006 + 2007 to extract the 40 thresholds to be used to filter 2006). Note that the level of agreement between methods and between subsequent years is variable, justifying the approach that propagates this variability into uncertainty in NEE.

