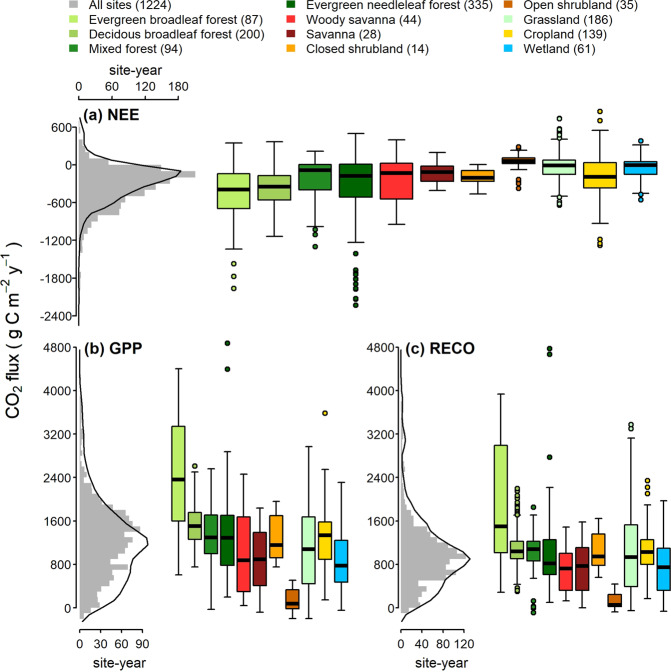
Fig. 6.
Distribution of the yearly (a) net ecosystem exchange (NEE), (b) gross primary production (GPP), and (c) ecosystem respiration (RECO) in FLUXNET2015. Only data with QC flag (NEE_VUT_REF_QC) higher than 0.5 are shown here. The values are reference NEE, GPP, and RECO based on the Variable USTAR Threshold (VUT) and selected reference for model efficiency (REF). GPP and RECO are based on the nighttime partitioning (NT) method. The grey histogram (bin width 100 gC m−2 y−1) shows the flux distribution in 1224 of the available site-years; negative GPP and RECO values are kept to preserve distributions, see Data processing methods section for details. Black lines show the distribution curves based on published data253,254. The boxplots show the flux distribution (i.e., 25th, 50th, and 75th percentiles) for vegetation types defined and color-coded according to IGBP (International Geosphere–Biosphere Programme) definitions. Circles represent data points beyond the 1.5-times interquartile range (25th to 75th percentile) plus the 75th percentile or minus 25th percentile (whisker). Numbers in parentheses indicate the number of site-years used in each IGBP group. The NO-Blv site from the snow/ice IGBP group is not shown in the boxplots.

