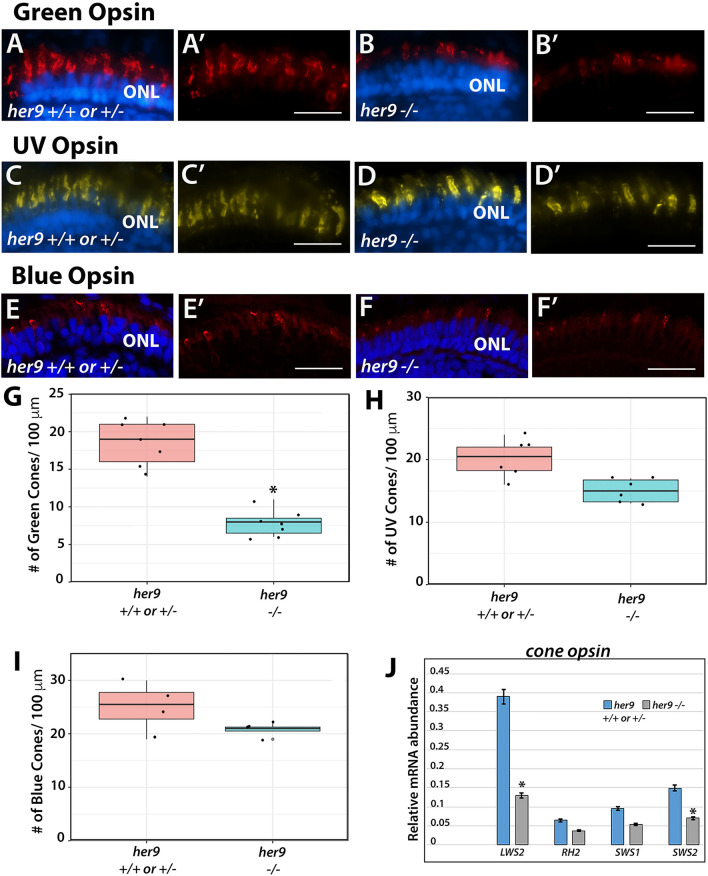
Figure 6.
Her9 mutants display cone subtype-specific phenotypes. Immunohistochemistry using a green (A–B′), UV (C–D′), or blue (E–F′) cone opsin antibody on WT and her9 mutant retinal cryosections. (G–I) Cell counts of opsin expressing cells in her9 mutant retinas compared to their siblings (# of opsin+ cells/100 µm). Green Opsin: WT/Het = 10 embryos; Mut = 10 embryos; t-test (p < .0004). UV Opsin: WT/Het = 10 embryos; Mut = 10 embryos; t-test (p < .0046). Blue Opsin: WT/Het = 10 embryos; Mut = 10 embryos; t-test (p = .1892). (J) qPCR analysis of the different cone opsins at 8 dpf (fold change relative to Ef1α). ONL, outer nuclear layer. Scale bar = 50 µm.

