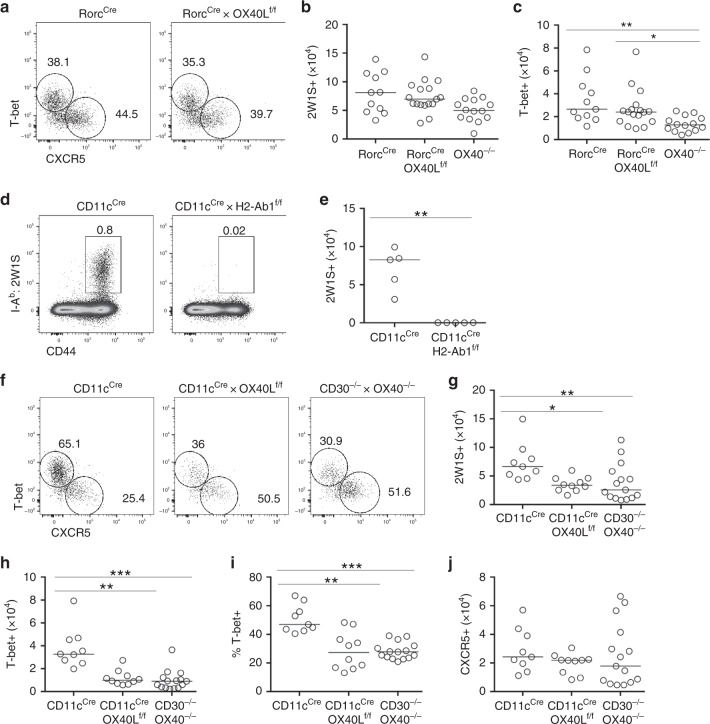
Fig. 3. Expression of OX40L by DC is required for effector Th1 responses.
To investigate the critical cellular interaction for generation of Th1 effector T cells, conditional OX40L-deficient mice targeting ILC3s (Rorccre) or DCs (CD11ccre) were generated. a Expression of T-bet versus CXCR5 by 2W1S-specific CD44hi CD4 T cells in Rorccre and Rorccre × OX40Lf/f mice. b Enumeration of CD44hi 2W1S-specific CD4 T cells in Rorccre, Rorccre × OX40Lf/f and OX40−/− control mice. c Enumeration of T-bet+ 2W1S-specific CD44hi CD4 T cells in Rorccre, Rorccre × OX40Lf/f and OX40−/− control mice. Data were pooled from 3 independent experiments (n = 11 Rorccre mice, n = 17 Rorccre × OX40Lf/f mice, n = 14 OX40−/− mice). d Representative flow cytometric plots showing CD44hi 2W1S-specific CD4 T cells in the spleen of CD11ccre and CD11ccre × H2-Ab1f/f mice at 7 days post infection. e Enumeration of CD44hi 2W1S-specific CD4 T cells. Data are representative of 2 independent experiments, n = 5 mice per group. f Expression of T-bet versus CXCR5 by 2W1S-specific CD44hi CD4 T cells in CD11ccre, CD11ccre × OX40Lf/f and CD30−/− × OX40−/− mice. g Enumeration of 2W1S-specific CD44hi CD4 T cells. h Enumeration of T-bet+ 2W1S-specific CD44hi CD4 T cells. i Percentage of 2W1S-specific CD4 T cells expressing T-bet. j Enumeration of CXCR5+ 2W1S-specific CD44hi CD4 T cells. Data were pooled from 3 independent experiments (n = 9 CD11ccre mice, n = 10 CD11ccre × OX40Lf/f mice, n = 15 CD30−/− × OX40−/− mice). Values on flow cytometric plots represent percentages; bars on scatter plots represents the median. Statistical significance was tested in e by using an unpaired, non-parametric, Mann–Whitney two-tailed T test and in b, c, h–j by using Kruskal–Wallis one-way ANOVA with post hoc Dunn’s test: *p ≤ 0.05, **p ≤ 0.01, ***p ≤ 0.001.

