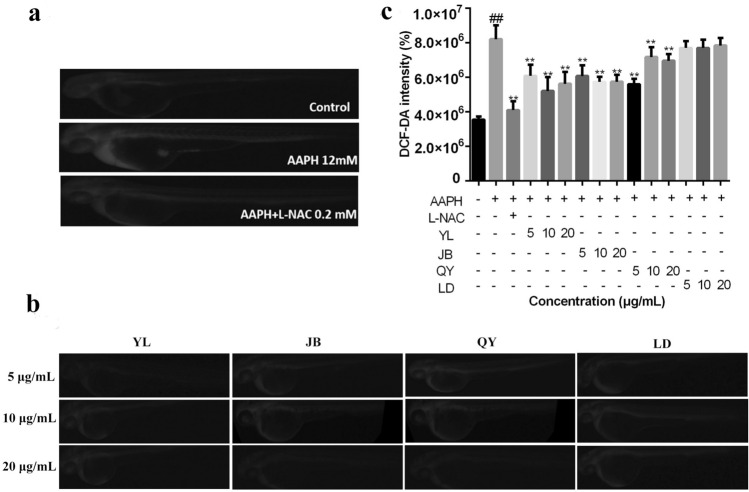
Figure 8.
Determination of ROS levels in zebrafish larvae from 48 hpf in Control group, AAPH-treatment group, AAPH + L-NAC-treatment group (a); Determination of ROS levels in zebrafish larvae from 48 hpf after treatment with YL-thyme oil, JB-thyme oil, QY-thyme oil and LD-thyme oil (b); Determination of mean DCF fluorescence intensity by Image analysis (c). The values are expressed as mean ± SD (n = 15). * Represents p-value less than 0.05 and ** represents p value less than 0.01 vs. AAPH-induced group; # represents p-value less than 0.05 and ## represents p-value less than 0.01 vs. control group.

