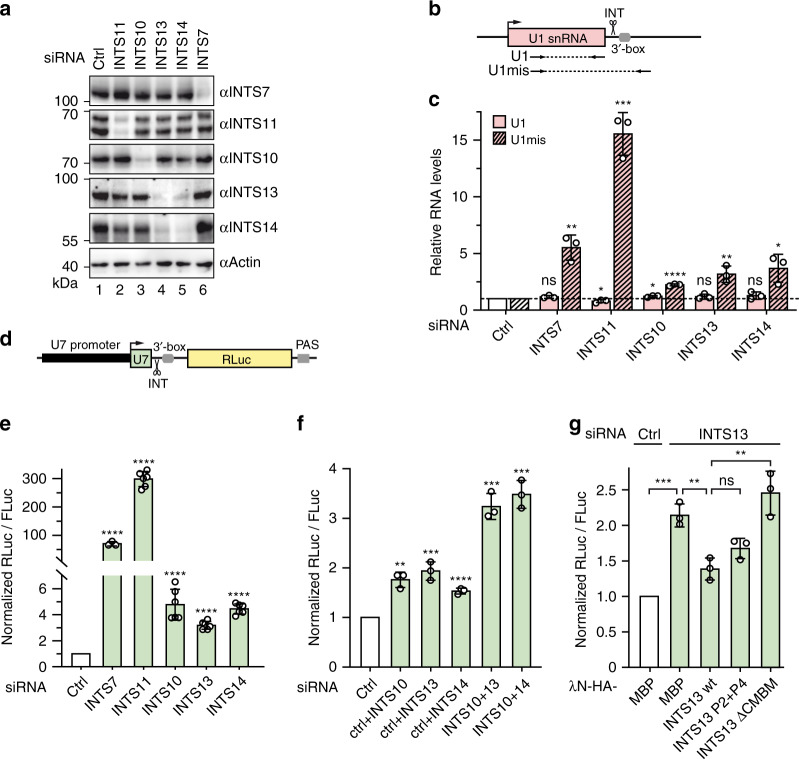
Fig. 6. The INTS10–INTS13–INTS14 module has an accessory role in UsnRNA processing.
a Representative Western blot of cells treated with siRNAs against INT subunits or non-targeting siRNA (corresponding to Fig. 7b). Actin served as loading control. b Scheme of qPCR-binding sites for amplification of mature (U1) and misprocessed (U1mis) U1 snRNA. c Relative U1 snRNA levels as determined by RT-qPCR. Clear bars represent U1 levels, while shaded bars represent levels of U1mis. All values were determined relative to U6 snRNA, which as an RNAPIII transcript is independent of INT, and were further normalized to the control knockdown condition. Statistical significance of U1 or U1mis levels was determined relative to their respective levels in the control depletion. d Scheme of U7 luciferase reporter construct used in e–g. Impaired U7 snRNA transcript cleavage by INT at the 3′-box leads to increased Renilla Luciferase (RLuc) levels. PAS polyadenylation signal. e, f Luciferase assay using the U7-reporter in cells depleted for individual INT subunits e or two INTS10–INTS13–INTS14 module subunits f. A plasmid expressing Firefly luciferase (FLuc) under control of a CMV promoter was used as transfection control. Statistical significance was determined for each knockdown relative to the control. g Rescue assays for INTS13 function in snRNA processing using the U7-reporter. Cells were treated with a control siRNA or INTS13 siRNA and transfected with HA-tagged INTS13 wt or mutants together with the reporter and FLuc transfection control. MBP served as negative control. All bar graphs depict mean values of biological triplicates shown together with individual values as dots, and error bars representing standard deviations. Statistical significance was determined by unpaired, two-tailed t-test: not significant (ns) p ≥ 0.05; significant *p ≤ 0.05, **p ≤ 0.01, ***p ≤ 0.001, ****p ≤ 0.0001. Western blots for all experiments and immunofluorescence assays for INTS13 mutants are shown in Supplementary Fig. 8. Source data are provided as a Source Data file.

