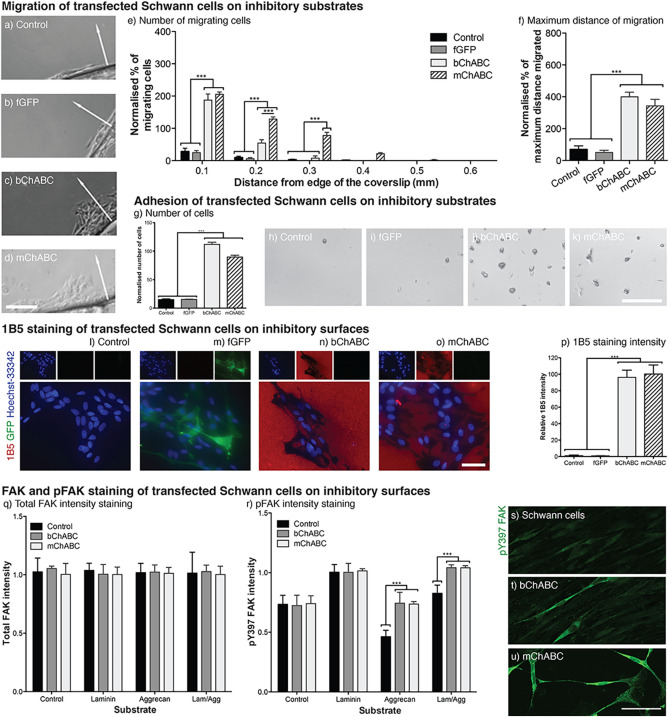
Figure 2.
mChABC increases Schwann cell migration and adhesion on aggrecan by removal of CS-GAGs. (a–f) Migration of Schwann cells on aggrecan showing (a) control, (b) LV-fGFP, (c) bChABC treated, and (d) LV-mChABC populations. Scale bar = 100 μm, arrows indicate direction of migration. Quantification of (e) cells migrating (N = 5, two-way ANOVA: cell type F(3,84) = 131.34, p < 0.0001, distance F(5,84) = 160.84, p < 0.0001) and (f) maximum distance (N = 5, one-way ANOVA: F(3,14) = 39.53, p < 0.0001). (g–k) mChABC increases cellular adhesion on aggrecan (g) to levels comparable with bChABC (N = 3, one-way ANOVA: F(3,12) = 68.61, p < 0.0001). Images showing (h) control, (i) LV-fGFP, (j) bChABC treated, and (k) LV-mChABC transduced cells. Scale bar = 100 μm. (l–p) anti-1B5 staining (red) of Schwann cells on aggrecan showing (l) control, (m) LV-fGFP, (n) bChABC treated, and (o) LV-mChABC populations immunostaned for anti-GFP (green) and Hoechst-33342 (blue) quantified in p) (N = 20, one-way ANOVA F(3,76) = 126.8, p < 0.0001). Scale bar = 40 μm. (q) Total FAK (N = 3, two-way ANOVA: cell type F(3,224) = 1.15, p = 0.329, substrate F(3,224) = 0.26, p = 0.8537) and (r) pFAK (N = 3, two-way ANOVA: cell type F(3,224) = 69.06, p < 0.0001, substrate F(3,224) = 491.82, p < 0.0001) levels in transduced cells on different substrates. Images show anti-pY397 FAK (green) staining of (s) control, (t) bChABC treated and (u) LV-mChABC transduced Schwann cells on an aggrecan substrate. Scale bar = 100 μm.

