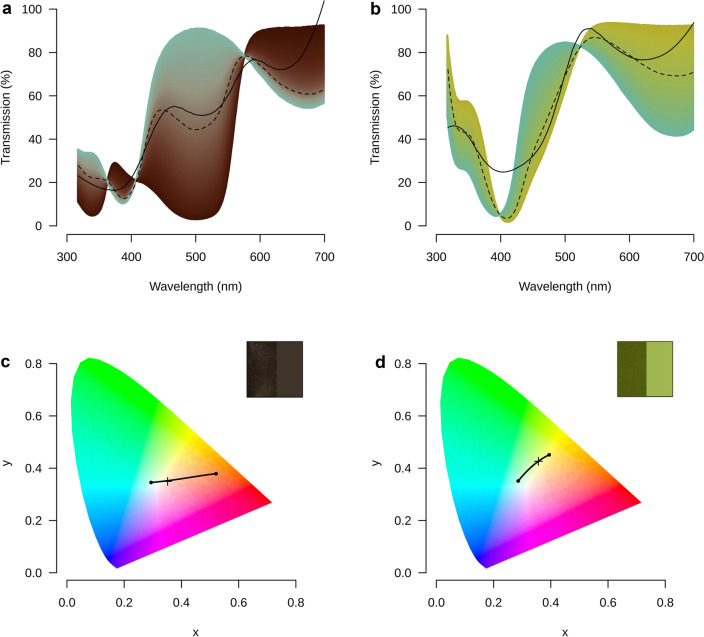
Figure 4.
Transmission spectra for the variable subtractive mixtures of (a) biliverdin and uroerythrin from N. maculosa and (c) biliverdin and bilirubin from E. elegans eggshells, respectively plotted in their modelled colours. Measured spectral reflectance of those eggshells (solid) is compared to the best predicted spectrum (dashed). All spectra are depicted from 318 to 700 nm. The colour of each spectrum is calculated from its spectrum, and the brightness of those colours was modified to approximate the reflectance of whole eggshells (solid black lines). Intermediate spectra for (b) biliverdin and uroerythrin and (d) biliverdin and bilirubin were plotted within the CIE coordinate space (small black dots) varying from entirely biliverdin (left most large dot) to entirely the novel pigment (rightmost large dot). For comparison, the reflectance values of whole eggshells are plotted (+ symbol) within each coordinate space. Insets (b) and (d): Colour swatch for our best prediction (left) compared against a close-up photograph of the surface colour (right).

