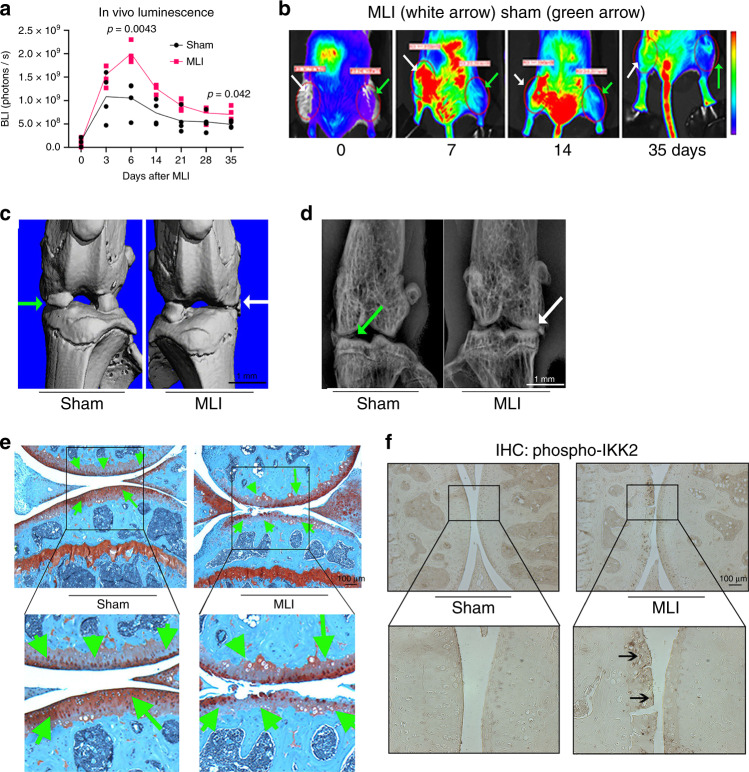
Fig. 2. NF-κB is activated in chondrocytes of PTOA knee joints.
MLI surgery was performed in 12-week-old NF-κB-luciferase reporter mice. Right knee joints were operated for MLI surgery and left knee joints were used for sham surgeries (n = 4 each group). a Bioluminescence imaging after MLI and sham surgery showed increased NF-κB activation in the MLI surgery joint (right leg) compared to sham-operated knee joint in the same animals over 5 weeks. Graphs display mean ± S.D for n = 4 mice per side. Two-tailed student’s t-tests were performed at each timepoint comparing the two groups with p-values indicated in figure. b Representative images of bioluminescence imaging from the same mouse at various times after surgery. c Representative μCT image and d X-ray image from one mouse showed joint damage, loss of synovial space and osteophyte formation in MLI surgery operated knee joint (white arrow). e Representative image of safranin-O staining of knee joints from same mouse shows loss of articular cartilage and proteoglycans after 8 weeks of MLI surgery compared to sham surgery. f Representative image from one mouse of IHC staining for p-IKK2 (arrows) in knee joints upon MLI surgery compared to sham surgery. e–f Scale bar = 100 μm.

