
Figure 6.
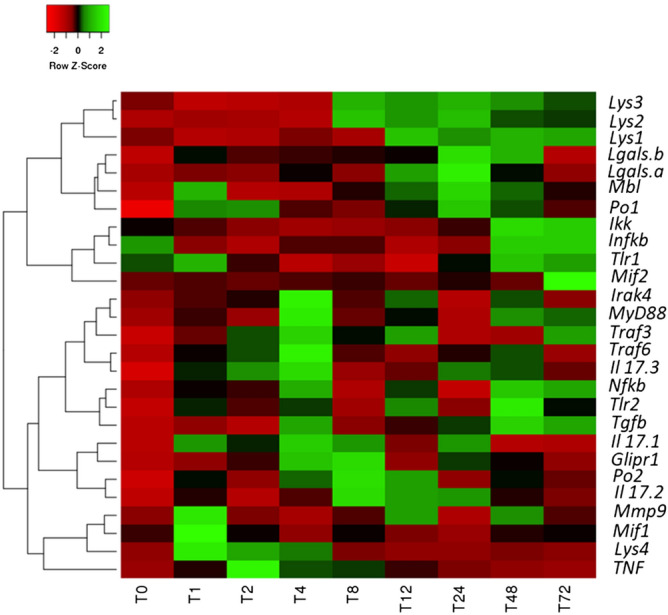
Heatmap based on the qRT-PCR analysis of the differentially expressed Tlr/MyD88-dependent and Nf-κB pathway and immuno-related genes at different times of exposure to LPS (1–72 h). Time course of gene expression in the pharynx of C. robusta exposed to LPS compared with the gene expression in untreated ascidians. Values are presented as the means ± SD. Statistical differences were estimated by one-way ANOVA and Tukey's t-test. The level of significance was set at a p-value ≤ 0.05 (N = 4).