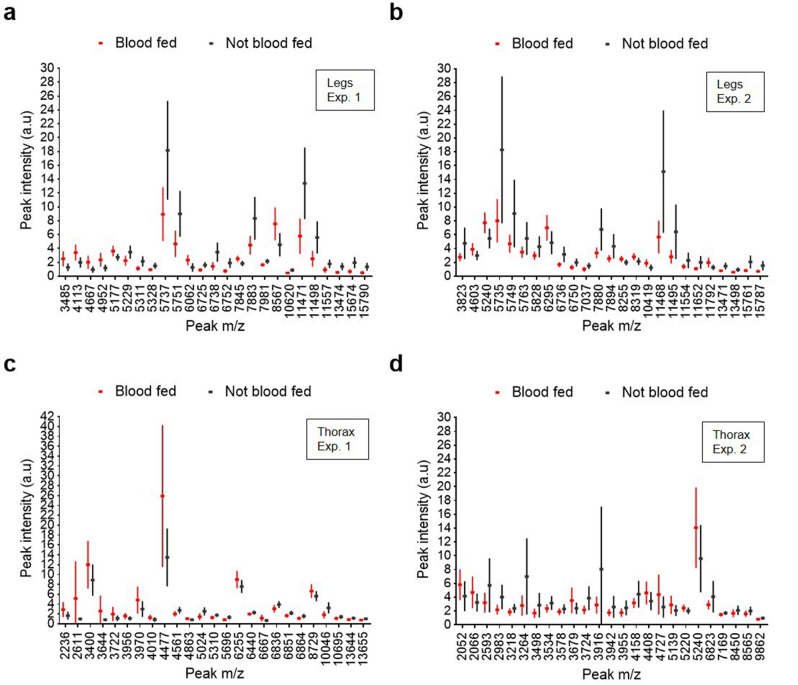
Figure 3.
Box and whisker plots demonstrating varying intensities of 25 peaks of distinct m/z (Da) for the complete dataset (line: mean, whiskers: standard deviation). Each peak corresponds to blood-fed (red) or non-blood-fed (black) mosquitoes of the same ages. (a, b) Spectra obtained using the legs of Anopheles stephensi that were blood fed (not infected) or were not blood fed during (a) experiment 1 and (b) experiment 2. (c, d) Spectra obtained using the thorax of Anopheles stephensi that were blood fed (not infected) or were not blood fed during (c) experiment 1 and (d) experiment 2.

