Figure 6.
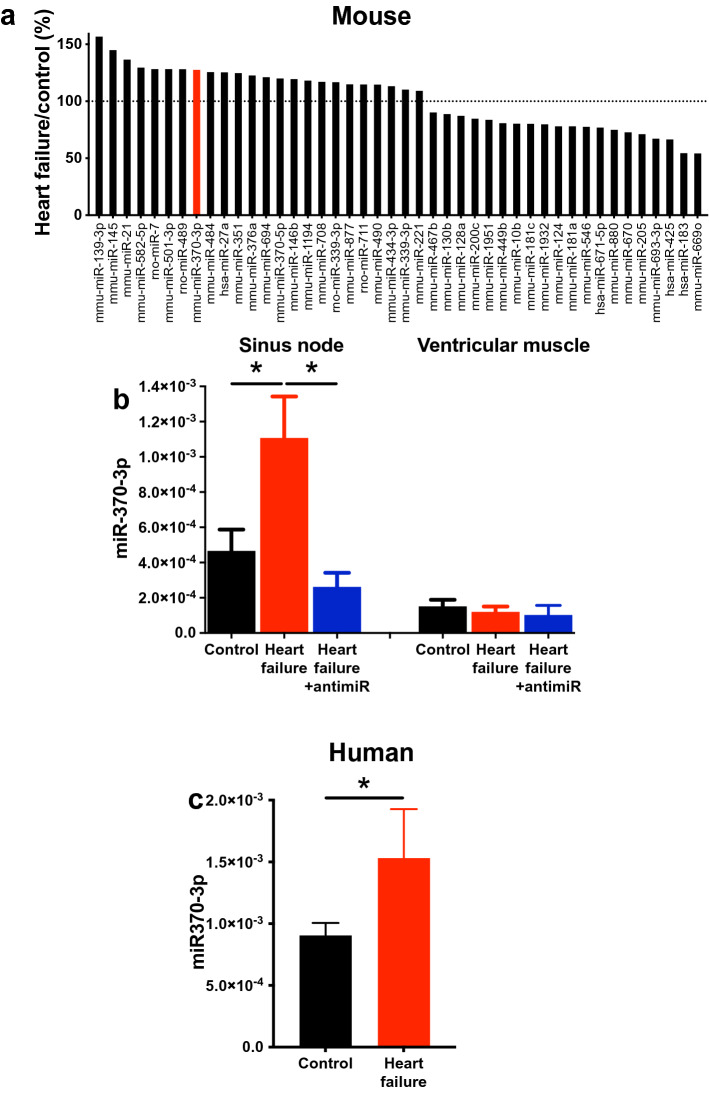
Dysregulation of microRNAs in heart failure. (a) 44 microRNAs that changed significantly in the sinus node in heart failure. The expression of each microRNA in heart failure mice is shown as a percentage of expression in control mice. The dotted line shows the control level. Based on data from 8 control and 10 heart failure mice. miR-370-3p is highlighted. (b) Expression of miR-370-3p in the sinus node (n = 7, 7 and 8) and ventricular muscle (n = 8, 9 and 7) of control mice given PBS, heart failure mice given PBS and heart failure mice given antimiR-370-3p. *P < 0.05; one-way ANOVA followed by Tukey’s multiple comparisons test. (c) Expression of miR-370-3p in the sinus node of control and heart failure patients (n = 3 and 5). *P < 0.05; after adjusting for effects of other factors and normalising differences between experiments, the General Linear Model was used to evaluate differences in miR-370-3p levels between control and failing human hearts.

