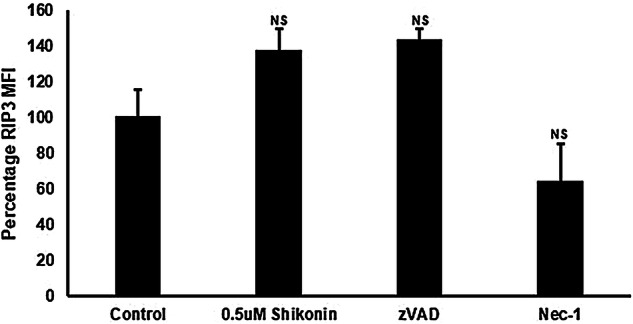
Fig.4.

Analysis of RIP3 expression. Live cells expressing RIP3 but not caspase-3 were analysed for RIP3 expression for untreated cells, then average percentage in RIP3 MFI ± SD were determined for 0.5 μM shikonin (24 h), 0.5 μM shikonin with 20 μM zVAD or 0.5 μM shikonin with 60 μM Nec-1. Average percentage of RIP3 MFI ± SD (n = 3), were analysed for significance by One Way ANOVA (P < 0.5) and post ad hoc tested for significance, NS (P = > 0.5, not significant), significance was P < 0.05*, P < 0.01**, P < 0.001***, P < 0.0001**** compared to untreated cells
