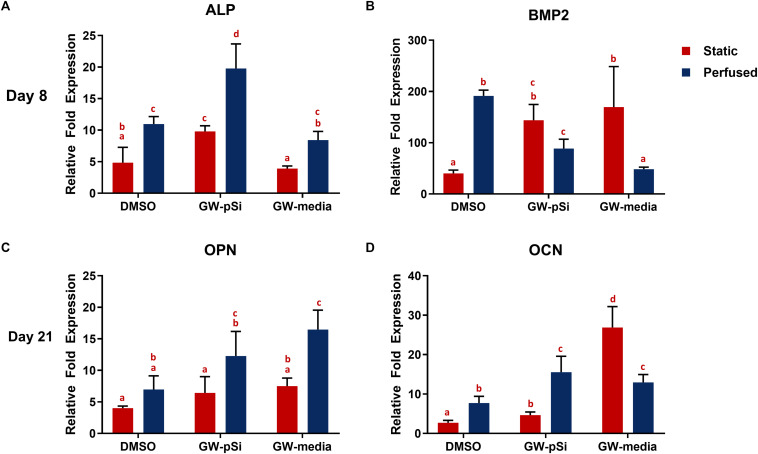
FIGURE 7.
qRT-PCR analysis for the expression of osteogenic markers in hMSCs after (A,B) 8 days or (C,D) 21 days of culture in various scaffold/media combinations. Fold changes were normalized to the expression levels of uninduced hMSCs after 8 or 21 days of 2D culture. Columns with matching letters indicate all possible comparisons were not significant (n = 3, error bars depict standard deviation, p < 0.05, two-way ANOVA, Tukey’s multiple comparison test).

