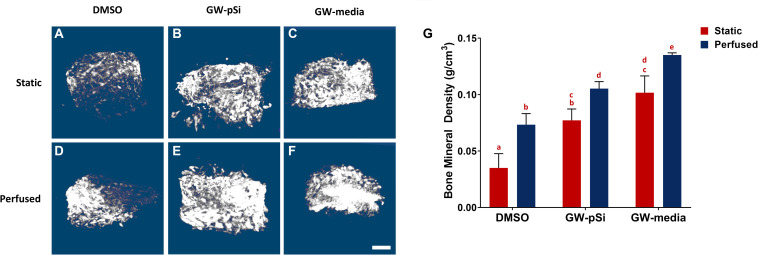
FIGURE 8.
Representative μCT reconstructions of scaffolds after 21 days of culture (A–F) (scale bar 500 μm). (G) Bone mineral density increases in response to both perfusion and GW9662. Columns with matching letters indicate all possible comparisons were not significant (n = 3, error bars depict standard deviation, p < 0.05, two-way ANOVA, Tukey’s multiple comparison test).

