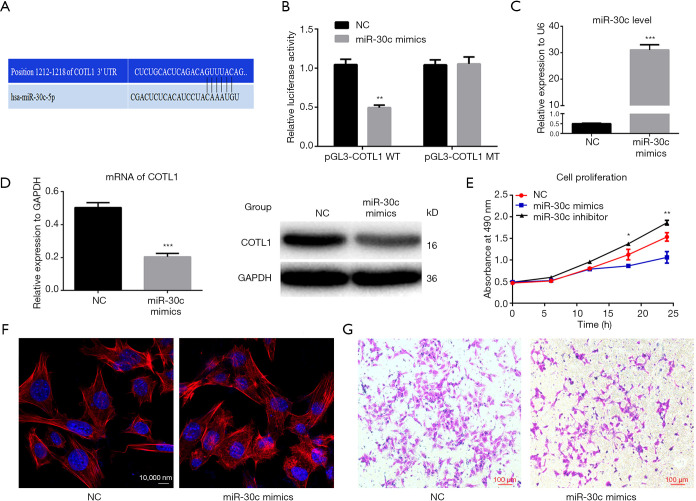
Figure 2.
The interaction between miR-30c-5p and COTL1, and their effects on cell invasion ability. (A) Bioinformatics prediction of the binding site of miR-30c-5p on the 3’ UTR region of the COTL1 gene. (B) Dual-luciferase reporter gene assay showed the average fluorescence intensity in the different groups. The data are presented as mean ± SE, and the results were from 3 independent assays. ** means P<0.01. (C) MiR-30c-5p expression levels were determined by RT-PCR after cells were transfected with miR-30c-5p mimics, with U6 being used for the loading control. (D) COTL1 mRNA and protein expression levels were determined by RT-PCR and Western blotting after cells were transfected with miR-30c-5p mimics; the data are presented as mean ± SE, and GAPDH was used as protein loading control. (E) Cell proliferation was evaluated by CCK8 assay kit after finished miR-30c-5p mimics transfection for another 24h, * and ** means P<0.05 and P<0.01, respectively. (F) Cell microfilaments were stained red by rhodamine phalloidin, while the nuclei were stained blue with DAPI. (G) Cell invasion ability was assessed by Transwell assay after cells were transfected with miR-30c-5p mimics. *** means P<0.001.

