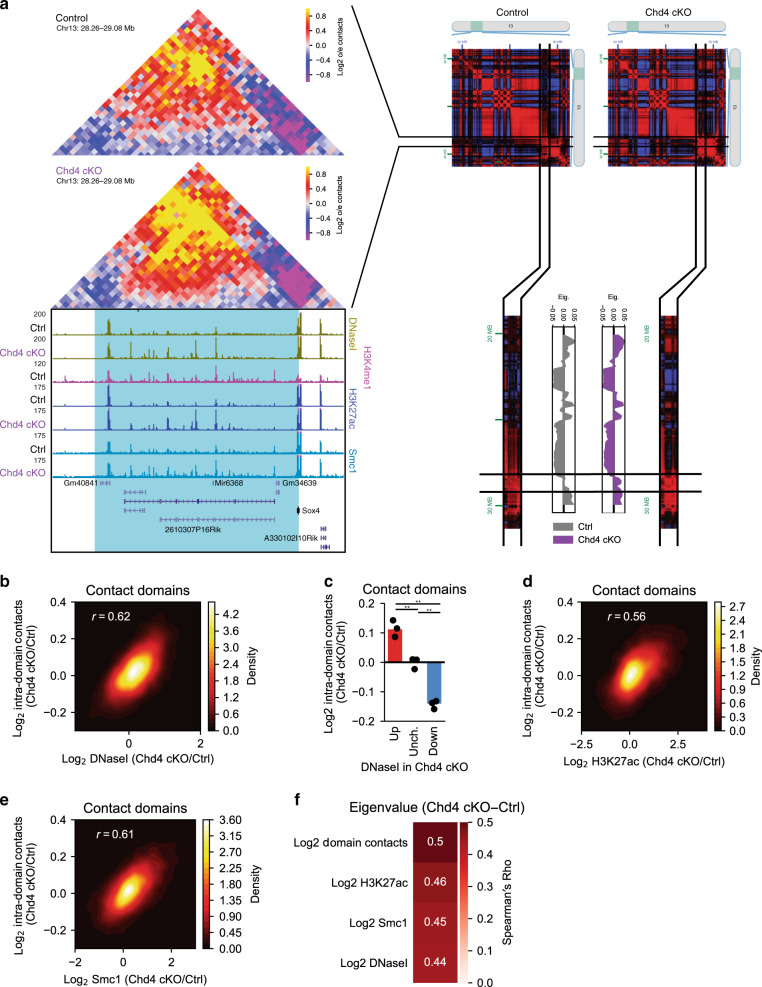
Fig. 2. Chd4 alters contact domain interactions and compartmentalization.
a (Left) Hi-C contact matrix of a contact domain on chromosome 13 and the flanking region. Below is a genome-browser snapshot of the region corresponding to the Hi-C contact matrix displaying the ChIP-seq profiles of H3K4me1, H3K27ac, and Smc1 as well as DNaseI-seq from the control and Chd4 cKO cerebellum. (Right) Juicebox browser snapshot of the Pearson’s correlation matrix of a region on chromosome 13 surrounding the contact domain. Below is the eigenvalue of the corresponding region on chromosome 13 in 150 kb bins, with the region surrounding the contact domain highlighted. b Density plot comparing the change in contact domain DNaseI-seq with the change in Hi-C contacts within the domain in the control and Chd4 cKO cerebellum. Pearson’s r, p < 0.001. c Change in Hi-C contacts within domains with increased (Log2FC > 0.585), unchanged (−0.585 < Log2FC < 0.585), and decreased (−0.585 < Log2FC) accessibility in the Chd4 cKO cerebellum. Points represent average of domains in individual biological replicates (n = 3). One-way ANOVA with Tukey’s post hoc HSD test. **p < 0.01. d, e Density plot comparing the change in contact domain (e) H3K27ac and (f) Smc1 ChIP-seq with the change in Hi-C contacts within the domain in the control and Chd4 cKO cerebellum. Pearson’s r, p < 0.001. f Spearman’s Rho comparing the difference in eigenvalue among contact domains and the change in domain contacts or other epigenomic features (Chd4 cKO/Ctrl).

