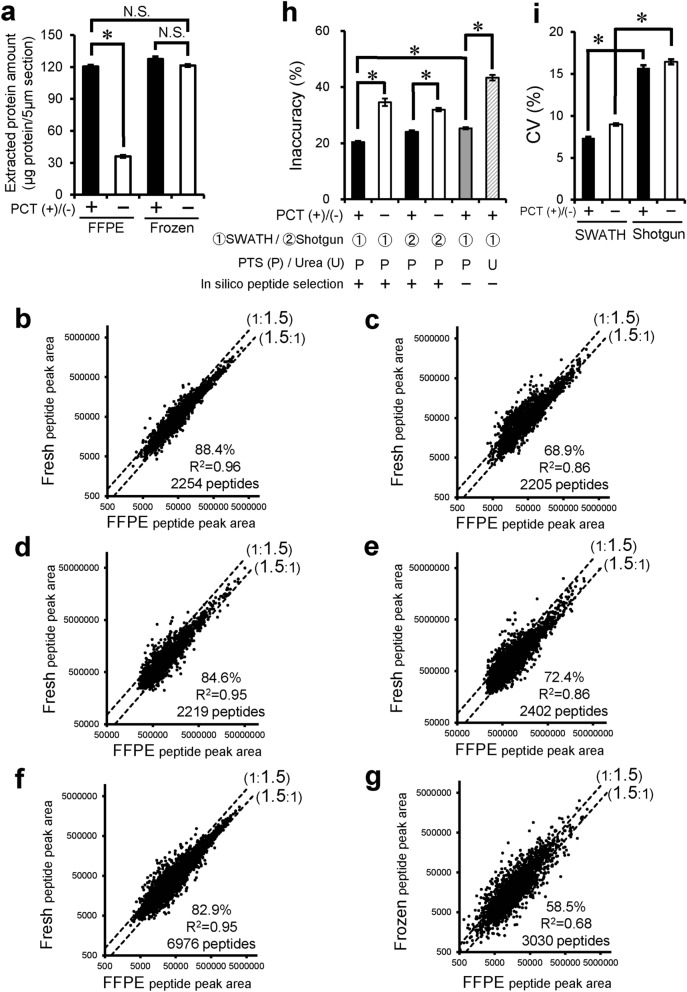
Figure 1.
Effect of PCT treatment, SWATH analysis, heat-compatible PTS buffer and in silico peptide selection criteria on comprehensive quantitative proteomics using FFPE sections of mouse liver. (a) Protein was extracted from FFPE and frozen sections of matched mouse liver with or without PCT. The experimental procedure is described in “Materials and methods”. Each column represents the mean ± SEM (n = 4). *p < 0.001, significant difference between two groups. N.S., no significant difference between two groups (p > 0.001) (Bonferroni-corrected Student’s t-test). (b–f) Peptide peak areas were compared between FFPE and fresh mouse livers. Peptide samples of FFPE and fresh livers were prepared with PCT treatment using PTS buffer (95 °C heating for lysis) and measured in the SWATH mode [b,f, PCT(+)-SWATH], prepared without PCT treatment (only incubation in PTS buffer at 95 °C for lysis) and measured in the SWATH mode [c, PCT(−)-SWATH], prepared with PCT treatment using PTS buffer (95 °C heating for lysis) and measured in the shotgun mode [d, PCT(+)-Shotgun], or prepared without PCT treatment (only incubation in PTS buffer at 95 °C for lysis) and measured in the shotgun mode [e, PCT(−)-Shotgun]. Data analysis for (b–e) was carried out as shown in Supplementary Fig. 2 with in silico peptide selection criteria. The data were taken from Supplementary Tables 2–5. Data analysis for f was carried out as shown in Supplementary Fig. 2, but without application of the in silico peptide selection criteria. Each point represents the mean (n = 4). The broken lines represent 1.5-fold differences. The % in each scatter plot is the proportion of peptides whose peak areas from FFPE samples lie within a 1.5-fold range of those from fresh samples. (g) This graph was generated using the data from the reported PCT-SWATH study.7 Peptide peak areas were compared between FFPE and frozen human benign prostatic tissues obtained from the same resected tissue of patient 15, who showed the best agreement (as an inaccuracy value) between FFPE and frozen peptide peak areas among the 24 patients. The peptide samples of FFPE and frozen prostatic tissues were prepared with PCT treatment using urea buffer without heating, and then measured in the SWATH mode. The in silico peptide selection criteria were not applied. The broken lines represent 1.5-fold differences. The % in each scatter plot is the proportion of peptides whose peak areas from FFPE samples lie within a 1.5-fold range of those from frozen samples. (h,i) Inaccuracy (h) and CV values (i) were calculated from panels b, c, d and e as described in “Materials and methods”, and the inaccuracy (h) were also calculated from panels (f) (gray column) and (g) (hatched column). Each column represents the mean ± SEM (n = 2,205–6,976 peptides; number commonly detected in FFPE and fresh samples under each experimental condition). *p < 0.001, significant difference between two groups (Bonferroni-corrected Student’s t-test).

