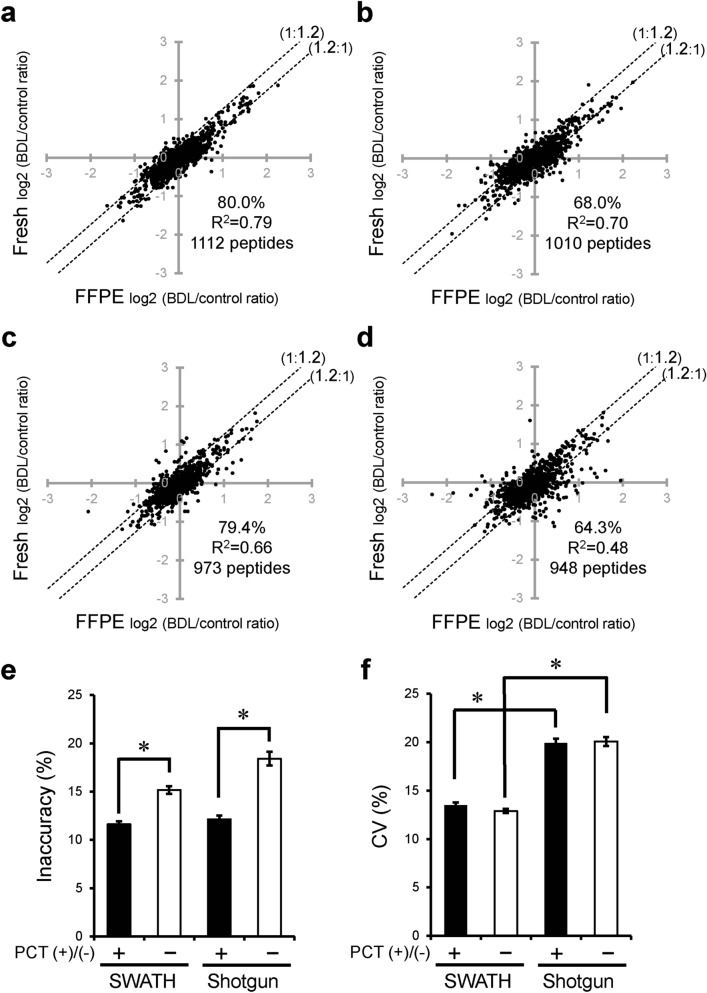
Figure 4.
Effect of PCT treatment and SWATH analysis on comprehensive quantification of BDL-induced changes in protein expression using FFPE sections. (a–d) BDL-induced changes in expression level (BDL/control ratio) were compared between FFPE and fresh samples of mouse liver at the peptide level. Peptide samples of FFPE and fresh livers were prepared with PCT treatment and measured in the SWATH mode (a, PCT(+)-SWATH), prepared without PCT treatment and measured in the SWATH mode (b, PCT(−)-SWATH), prepared with PCT treatment and measured in the shotgun mode (c, PCT(+)-Shotgun), or prepared without PCT treatment and measured in the shotgun mode (d, PCT(−)-Shotgun). Data analysis was carried out as described in Supplementary Fig. 3. The data were taken from Supplementary Tables 7–10. Each point represents the mean (n = 4). The broken lines represent 1.2-fold differences. The % in each scatter plot is the proportion of peptides whose peak areas from FFPE samples lie within a 1.2-fold range of those from fresh samples. (e,f) Inaccuracy (e) and CV values (f) obtained from panels (a–d) were calculated as described in “Materials and methods”. Each column represents the mean ± SEM (n = 948–1,112 peptides; number commonly detected from FFPE and fresh samples under each experimental condition). *p < 0.001, significant difference between two groups (Bonferroni-corrected Student’s t-test).

