
Figure 2.
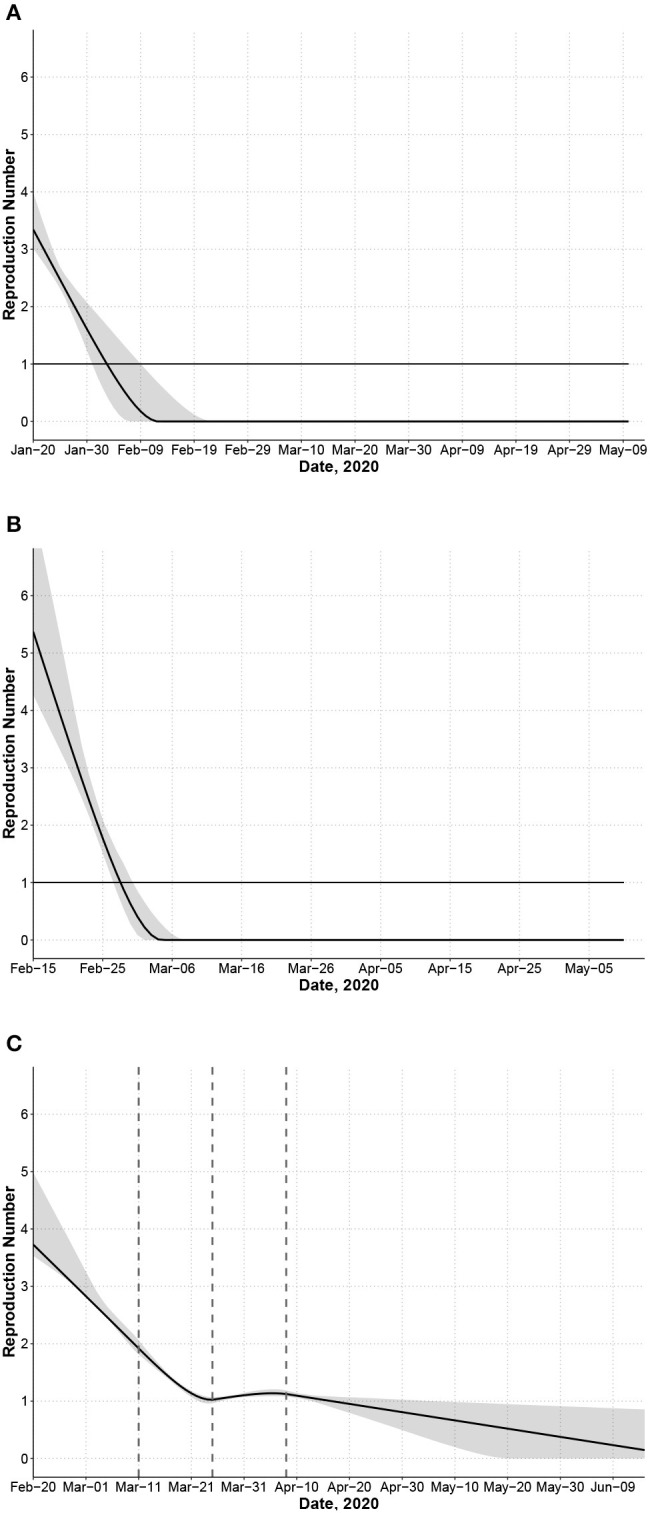
Effective reproduction number Rt for each country computed as the average number of secondary infections generated by a primary case at time t accounting for the incubation period of the primary case. Dashed lines indicate knots for transmission rate a(t). (A) China. (B) South Korea. (C) Italy.