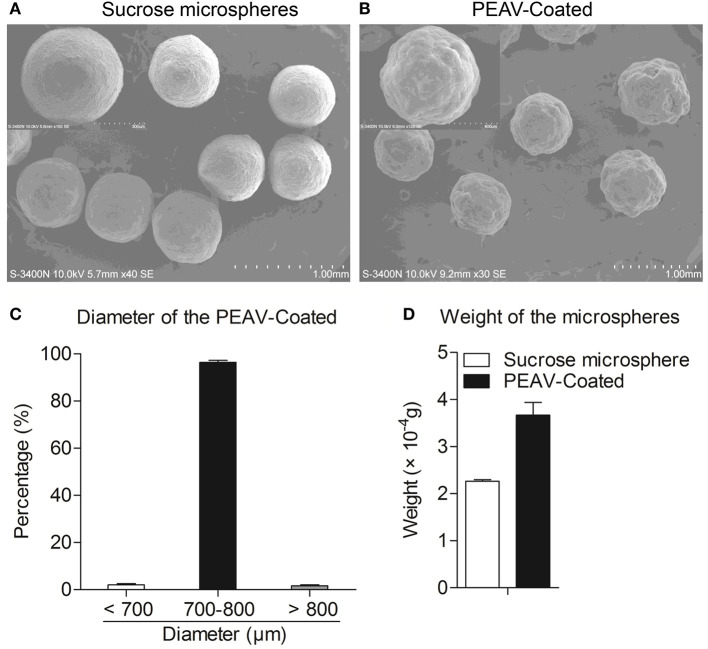
Figure 2.
Appearance, size distribution, and weight gain of PEAV-Coated. Scanning electron micrographs of sucrose microspheres (A) and PEAV-Coated (B) (scale bar 1.0 mm, 300 μm or 400 μm in A,B). (C) Size distribution of freshly prepared PEAV-Coated was measured using a Vernier caliper and data were plotted as the percentage of different diameters. (D) One hundred freshly prepared PEAV-Coated or sucrose microspheres were randomly selected and measured with Electronic scales to calculate the weight gain of the single microsphere. Results are representative of three independent experiments. Data are represented as mean ± SD, n = 3.

