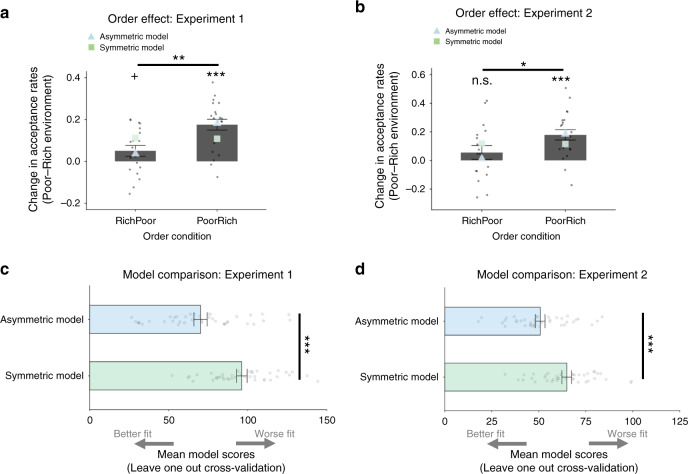
Fig. 3. Order effect and model comparison.
a Participants who experienced the poor environment followed by the rich environment (PoorRich group, N = 21) changed choices between environments to a greater extent than participants who experienced a rich environment followed by a poor (RichPoor group, N = 19) environment (t(38) = 3.41, p = 0.002, two-tailed independent t-test comparing the change in acceptance rates between these two groups of participants). The Asymmetric Model was able to recapitulate this order effect by having separate learning rate for when reward rate estimates increased and when they decreased. The Symmetric Model which had a single learning rate predicted that the change in acceptance rates between environment ought to be the same for RichPoor and PoorRich participants. Gray dots represent individual data points and gray bars represent the group mean. Blue triangles represent the pattern of choices generated by simulations from the Asymmetric Model. Green squares represent the pattern of choices generated by simulations from the Symmetric Model. b This pattern of results replicated in a second experiment (t(36) = 2.08, p = 0.045, two-tailed independent t-test comparing the change in acceptance rates between these two groups of participants) (PoorRich group, N = 21; RichPoor group, N = 17). c The Asymmetric Model provided a superior fit to the data than the Symmetric Model in Experiment 1 (t(39) = 7.20, p = 1.1551E-8, two-tailed paired sample t-tests comparing LOOcv scores for the Asymmetric versus the Symmetric Model. Plotted are the mean LOOcv scores over subs (N = 40) for each model. d The Asymmetric Model provided a superior fit to the data than the Symmetric Model in Experiment 2 as well (t(37) = 6.04, p = 5.4824E−7, two-tailed paired sample t-tests comparing LOOcv scores for the Asymmetric versus the Symmetric Model). Plotted are the mean LOOcv scores over subs (N = 38) for each model. Dots represent individual data points and bars represent the group mean. Error bars represent mean ± standard error of the mean. +0.05 < p < 0.10; *p < 0.05; **p < 0.01; ***p < 0.001: independent sample t-test/paired sample t-test/one-sample t-test (vs. 0) as appropriate (all two tailed) n.s. non-significant. Source data are provided as a Source Data file.

