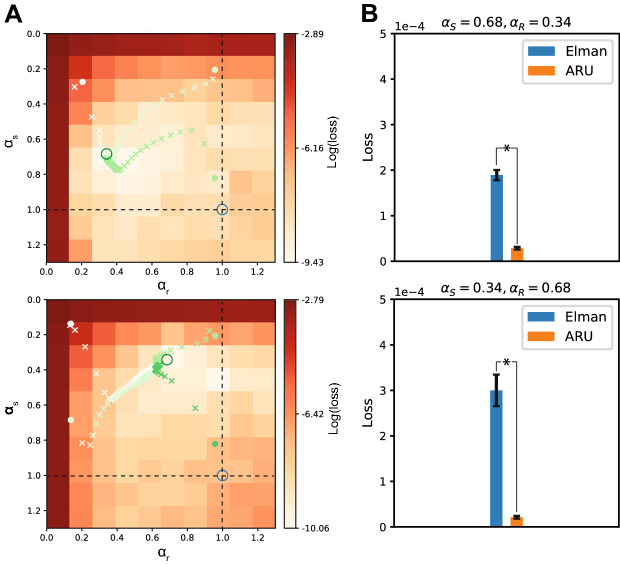
Figure 3.
Optimizing rate constants through backpropagation. Instead of choosing the rate constants manually, the BPTT algorithm was used to optimize them, along with the rest of the parameters of the network. (A) For two combinations of target rate constants (, , top panel) and (, , bottom panel) the optimization of the rate constants is plotted over the grid search results of Fig. 2. The target rate constants are marked by a green circle. Different initializations of the rate constants were tested, as indicated by the filled circles with different shades of green. The learned values after each epoch are marked by a cross of the same color. The dashed lines indicate the approximation where either or . The intersection of both dashed lines indicates the Elman solution (blue circle). Independent of initialization, the learned rate constants all converge to the target rate constants, closely recovering the correct values. (B) The performance of the ARU model with learnable rate constants was compared with the classical Elman model. The ARU model performed significantly better than the Elman network (* and * for the top and bottom panels, respectively) for both data sets (error bars represent standard error over 20 repetitions).

