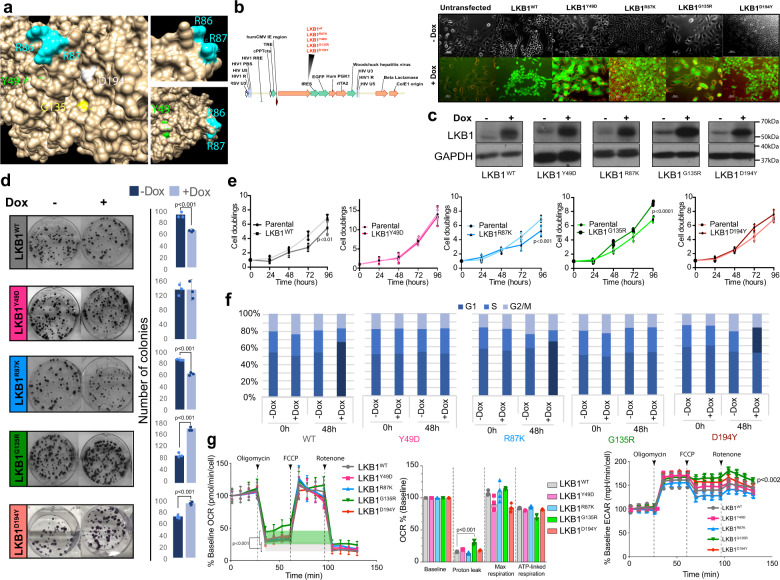
Fig. 1. LKB1Y49D, LKB1G135R, and LKB1D194Y mutants lack the LKB1WT tumor suppressor activity.
a Localization of mutated residues within the 3D structure of the LKB1-STRADα-MO25α complex (2WTK.pdb). Mutated residues are indicated. b Vector map used to clone the different LKB1 isoforms; on the right, expression of GFP in uninduced and induced infected cells with the different constructs is shown. c Western blot, showing the induction of expression of the different LKB1 isoforms in A549 cells, 24 h after doxycycline treatment. d Clonogenic assay with cells expressing the different LKB1 isoforms. Graphs show the quantification of the number of colonies. (n = 3 experiments ±SD). e Representative proliferation curves, showing the effect of LKB1 mutants on cell proliferation (n = 3 experiments ±SD; p-value was calculated by Student’s t test). f Graphs showing cell cycle analysis of cells expressing the different LKB1 isoforms for 48 h. Dark blue bars represent cell cycle phases showing significant changes (n = 3, p < 0.05 calculated by Student’s t test). g Graphs showing oxygen consumption rates (OCR), parameters associated (oxygen consumption baseline; mitochondria proton leak; mitochondrial maximal respiration and ATP-linked respiration), and the extracellular acidification rates (ECAR). The green area and the gray area represent proton leak from LKB1G135R and LKB1WT expressing cells, respectively (n = 5 ± SD; p-value was calculated by Student’s t test).

