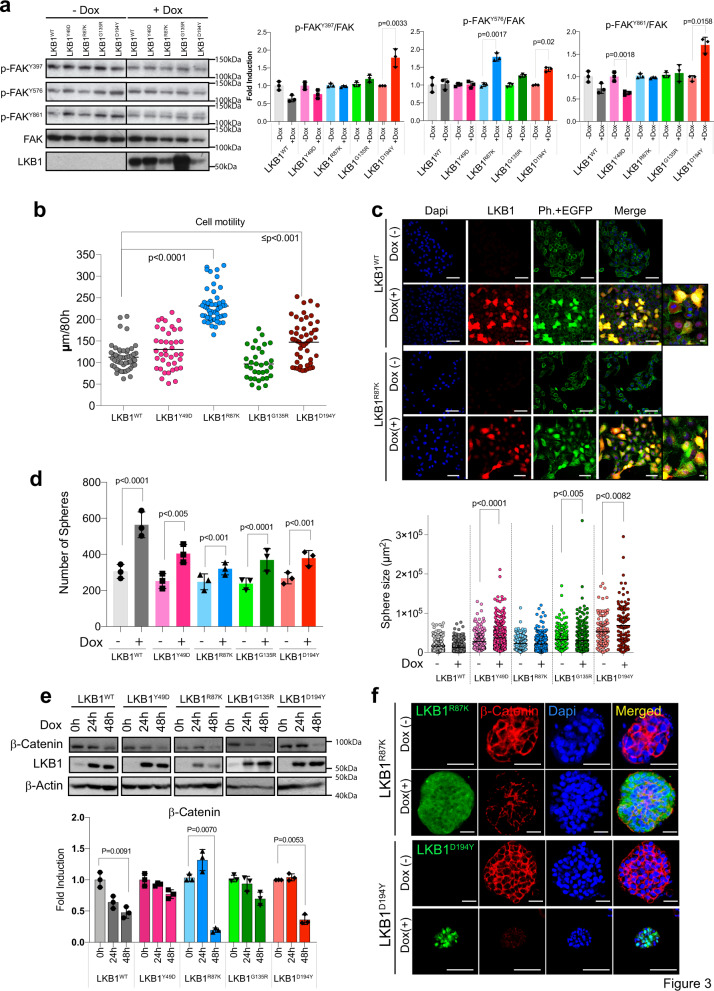
Fig. 3. Differentially regulated cell motility by LKB1 mutant isoforms.
a Western blot showing the regulation of FAK phosphorylation after the expression of LKB1 mutant isoforms for 48 h. Graphs show quantification of every phosphorylation site. (n = 3, p-value was calculated by Student’s t test). b A graph showing the quantification of A549 cell motility induced by LKB1 isoforms. The movement of 35–50 cells expressing each different isoform (colored circles) was quantified for 80 h and plotted. The p-value was calculated by Student’s t test. c Representative images of LKB1 immunofluorescence (red) and F-actin (phalloidin, green). Cells appear filled with green upon doxycycline treatment because of IRES-GFP expression linked to LKB1 expression. Bars represent 100 µm and 20 µm. d Graphs showing the quantification of the number and size of spheres grown in Matrigel upon expression of the indicated LKB1 isoform. For number of spheres experiments were performed in triplicate. For determining size, 200 spheres per group (from the three experiments) were analyzed. p-value was calculated by Student’s t test. e Representative western blot showing the amount of β-Catenin upon LKB1 isoform induction. β-Actin is shown as loading control. Graphs shows normalized quantification. (n = 3, p-value was calculated by Student’s t test). f Immunoflurescence of Matrigel spheres showing the amounts of β-catenin upon the expression of the indicated LKB1 isoforms. DAPI staining shows nuclear staining. Bars represent 500 µm.

