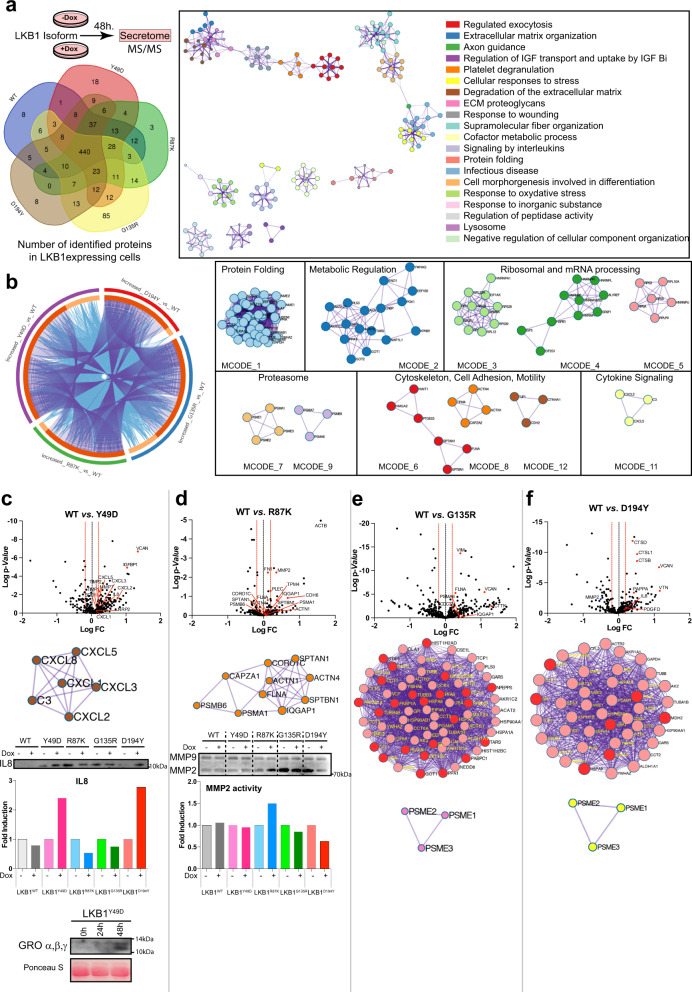
Fig. 5. Secretome analysis induced by LKB1 isoforms identified differential alterations in exocytosis regulation, cell adhesion and motility, and cytokine signaling.
a The recovered conditioned media from A549 parental and LKB1-isoform induced cells (after 48 h) was analyzed by mass spectrometry. Venn diagram showing the common proteins identified in the secretomes obtained from cells expressing the different LKB1 isoforms. On the right, a functional enrichment and interactome analysis of all the protein identified after LKB1-isoform expression is shown. The intracluster and intercluster similarities of enriched terms are shown. Cluster annotations are shown in color coded. (metascape.org). b Circos plot showing the overlap between protein lists (increased proteins in the LKB1 mutant isoforms vs. LKB1WT). The purple curves indicate overlap at the protein level and the blue curves link proteins that belong to the same enriched ontology term. On the right the protein–protein interaction network and the MCODE component48 identified in the gene lists are shown. c Volcano plot depicting protein data p-values vs. fold change after comparison of proteomics data from LKB1WTvs. LKB1Y49D cells. The most representative protein–protein interaction network is shown. Below, western blot showing the levels of IL8 and CXCL1, CXCL2, and CXCL3 in A549 cell’s conditioned media after 48 h of LKB1 induction (IL8) or at the indicated time points. The graphs show quantification of the bands. Ponceau S was used as a loading control. d Same as in c, showing data from LKB1WT vs. LKB1R87K cells. Below, zymogram showing the MMP9 and MMP2 activity in conditioned media upon induction of the different LKB1 isoforms. The graphs show quantification of the bands. e, f Same as in c showing data from LKB1WT vs. LKB1G135R and LKB1WT vs. LKB1D194Y cells, respectively. In the protein network, pink circles depict shared proteins between two sets of samples and red circles represent proteins detected only in each set.

