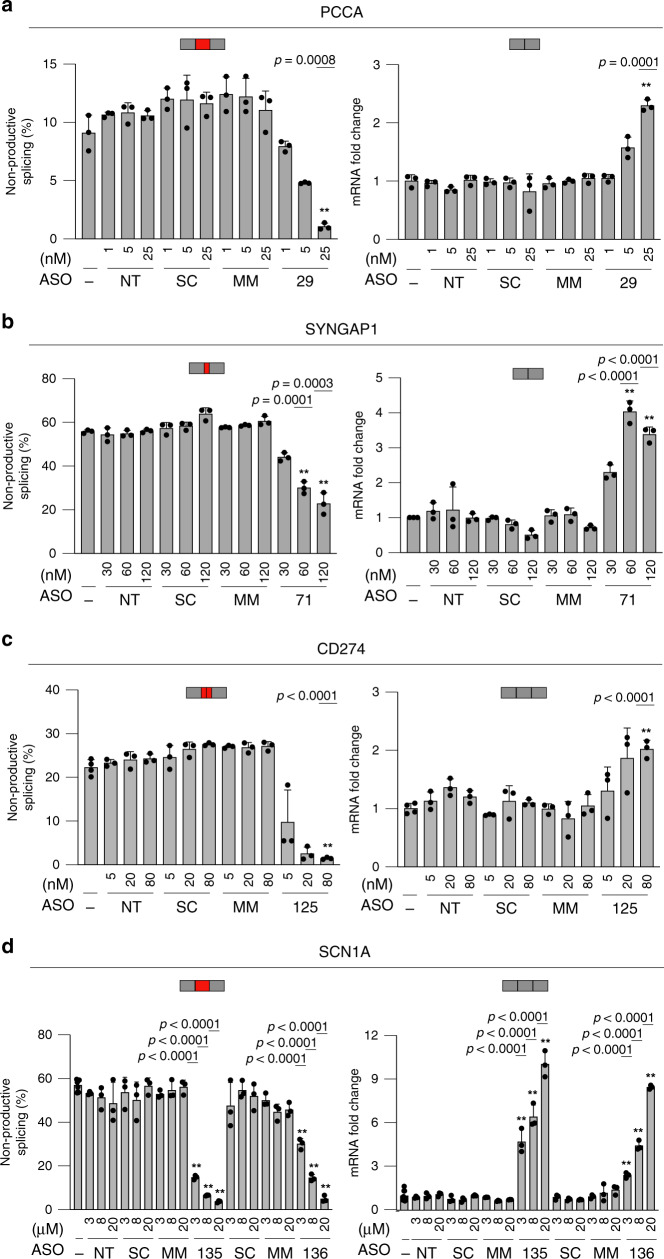
Fig. 4. ASOs dose-dependently reduce NMD and increase mRNA in vitro.
a RT-PCR (left panel) and qPCR (right panel) of a selected PCCA ASO (ASO-29) targeting the exon inclusion event transfected in HEK293 cells at increasing concentrations for 24 h. Exact p-values for bars with asterisks are 0.0008 and 0.0001, respectively. b RT-PCR (left panel) and qPCR (right panel) of a selected SYNGAP1 ASO (ASO-71) targeting the alternative 3′ss transfected in HEK293 cells at increasing concentrations for 24 h. Exact p-values for bars with asterisks are 0.0001 and 0.0003, 6.99e-5 and 4.25e-5, respectively. c RT-PCR (left panel) and qPCR (right panel) of a selected CD274 ASO (ASO-125) targeting the alternative intron transfected in Huh7 cells at increasing concentrations for 24 h. Cell were treated with 50 μg/mL of CHX for 3 h prior to harvesting to visualize and quantify the non-productive mRNA. Exact p-values for bars with asterisks are 6.38e-6 and 9.21e-5, respectively. d RT-PCR (left panel) and qPCR (right panel) of two selected SCN1A ASOs (ASO-135 and ASO-136) targeting the exon inclusion event delivered by free uptake into ReNCell VM cells at increasing concentrations for 72 h. RT-PCR results (bar graphs on the left) show dose-dependent reductions of the non-productive mRNA and qPCR results (bar graphs on the right) show dose-dependent increases of productive mRNA. Exact p-values for bars with asterisks are 1.69e-10, 2.50e-11, and 1.49e-11; 2.91e-8, 2.05e-10, and 2.59e-11; 4.21e-7, 1.10e-8, and 1.35e-10; and 7.26e-5, 4.01e-8, and 9.08e-12, respectively. No-ASO (−), scramble (SC), and mismatch (MM) controls were included in each experiment at the same increasing concentrations as the respective targeting ASOs. All experiments were performed in three biological replicates. Data are presented as mean values ±SD. P-values were calculated using two-sided t-test. Asterisks denote ASOs that are statistically significant (p < 0.001) in both RT-PCR and qPCR analyses. Red and gray rectangles denote NMD-inducing event and protein-coding exons, respectively. Source data are provided as a Source Data file.

