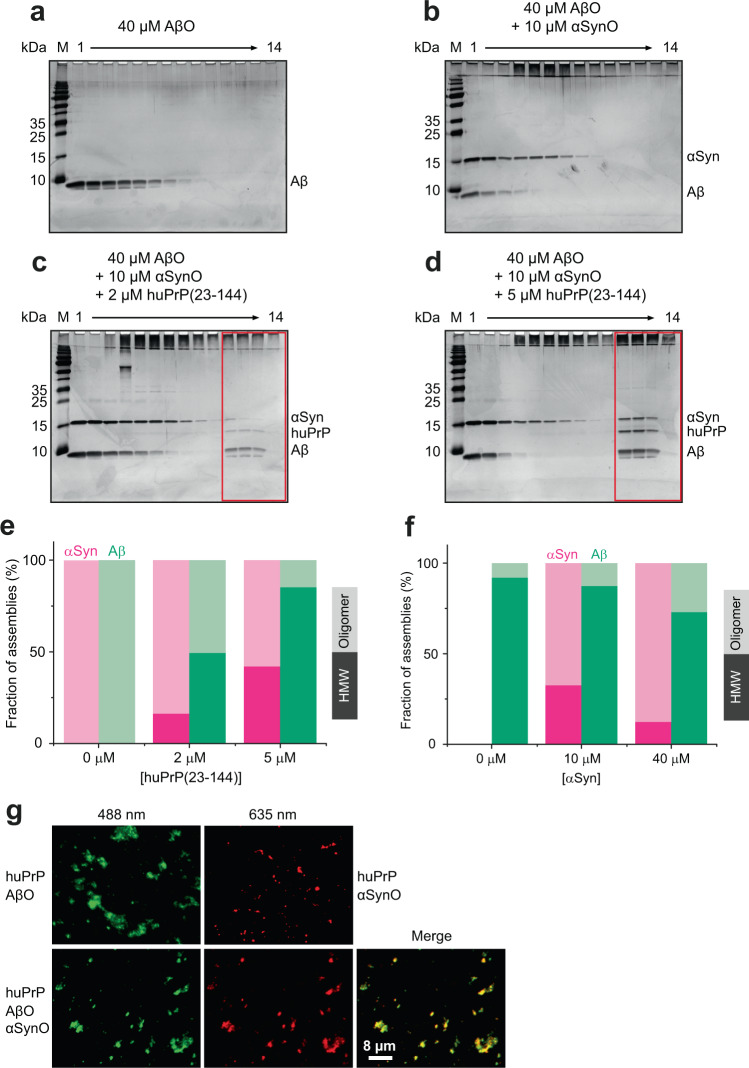
Fig. 7. αSynO and AβO cocluster with huPrP(23−144).
a–d Silver-stained SDS-PAGE gels after DGC of 40 µM AβO alone (a) and mixtures of 40 µM AβO and 10 µM αSynO containing either b no, c 2 µM, or d 5 µM huPrP(23−144). Coclustering of all proteins as heteroassemblies is detectable in DGC fractions 11−14 (red boxes). e, f Quantitative analysis by RP-HPLC of the distribution of assemblies into oligomer fractions (4−9) vs. HMW fractions (10−14). In (e), different amounts of huPrP(23−144) were added to a mixture of 40 µM AβO and 10 µM αSynO, corresponding to the gel images in (b–d). In (f), different amounts of αSynO were added to a mixture of 4 µM huPrP(23−144) and 40 µM AβO, corresponding to the gel images in Supplementary Fig. 4. g TIRFM of AβO (top left, 40 µM, 10% FITC-labeled), αSynO (top right, 10 µM, 10% ATTO633-labeled), and a mixture of both (bottom row, 40 µM AβO, 10% FITC-labeled, and 10 µM αSynO, 10% ATTO633-labeled), all in the presence of 2 µM huPrP(23−144). Excitation wavelengths were 488 nm for AβO (left) and 635 nm for αSynO (middle), emission wavelengths were 525 nm for AβO and 705 nm for αSynO. A merged image of the AβO and αSynO fluorescence channels is shown on the right.

