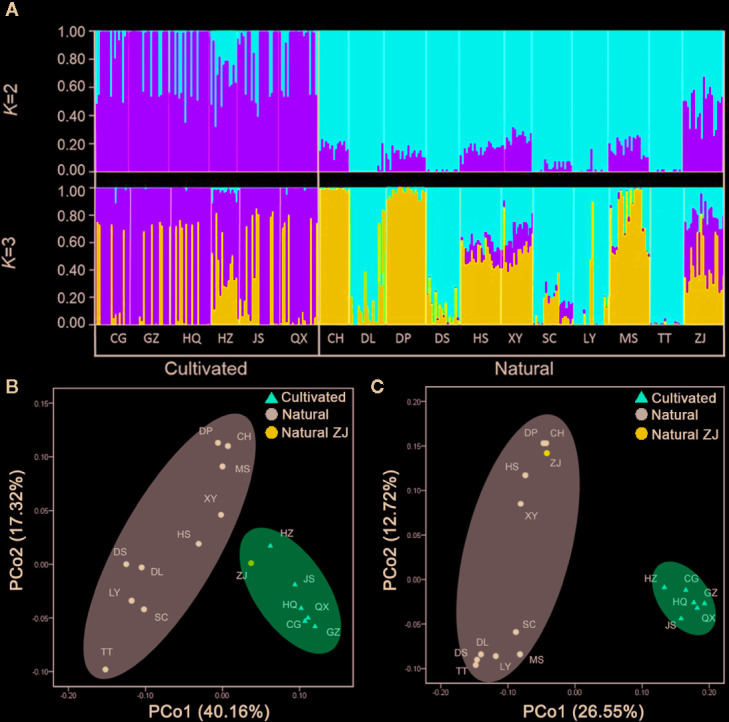
Figure 3.

Genetic and epigenetic populations structure of C. yanhusuo using STRUCTURE and PCoA analysis. (A) Individual assignment to each cluster for K=2 to 3 based on genetic dat. Each individual is represented by a thin vertical line. Principal coordinates analysis (PCoA) among C. yanhusuo based on the AFLP profile (B) and MSAP profile (C).
