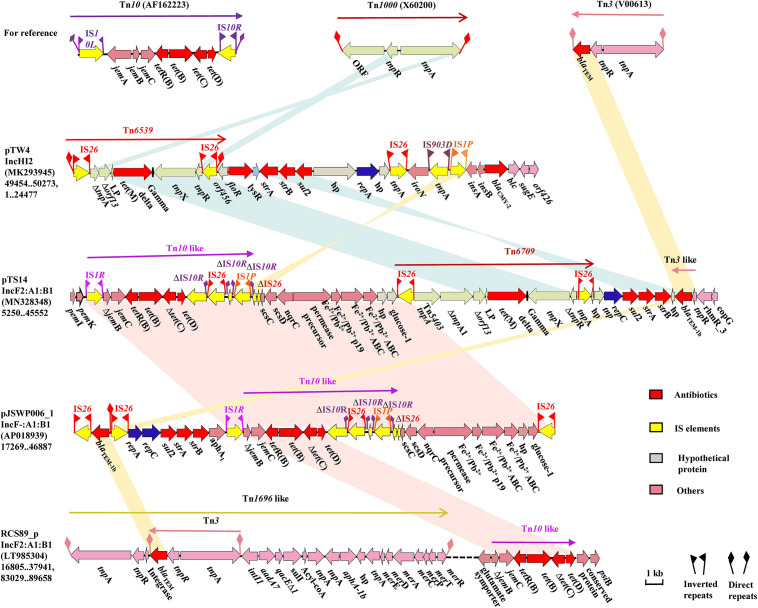
FIGURE 2.
The MDR region of plasmid pTS14 and comparisons with related regions. Genes, mobile elements and other features are colored based on functional classifications. Numbers in parentheses show the nucleotide positions within the corresponding plasmids. Shaded regions denote homologous DNA regions (>97% nucleotide identity). Resistance genes are in red; mobile elements are in yellow; hypothetical proteins are in gray, and others in pink.

