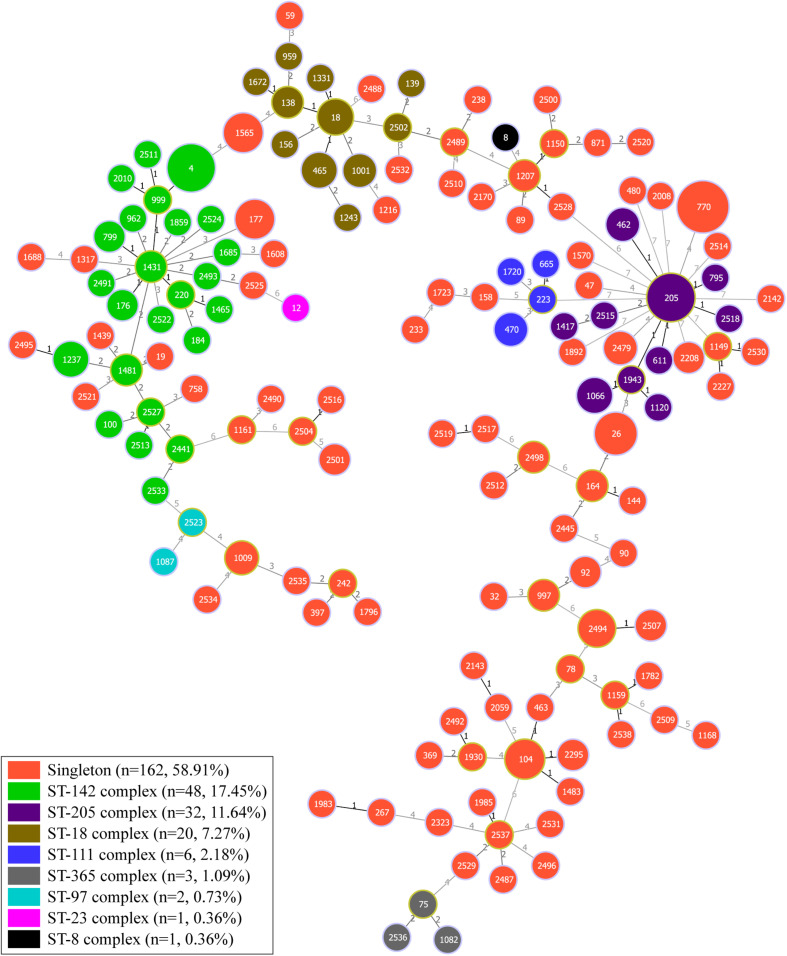
FIGURE 3.
Minimum spanning tree and genetic diversity of 275 B. cereus isolates from aquatic products. Each color represents one clonal complex or a group of singletons. The numbers inside the pie chart are the corresponding sequence types (STs), and the size of the pie chart is proportional to the number of isolates in the corresponding ST. The number along the line indicates the variation of the seven loci between two strains at both ends of the line.

