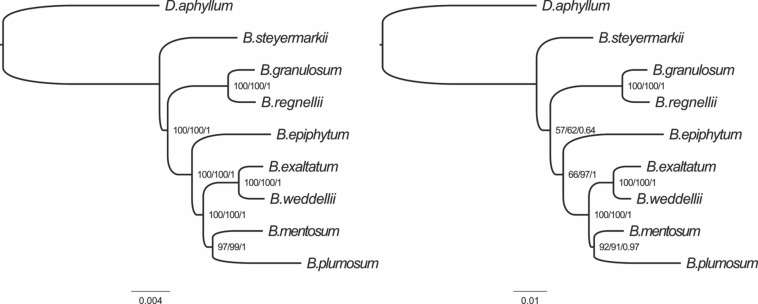
FIGURE 8.
Phylogenetic relationships of the eight Bulbophyllum species constructed from whole genome (left) and the 10 most-variable regions (right) with maximum parsimony (MP), maximum likelihood (ML), and Bayesian inference (BI) methods. ML topology and branch length are represented. Numbers associated with branches are bootstrap percentages of MP/ML and BI posterior probabilities (in this order).

