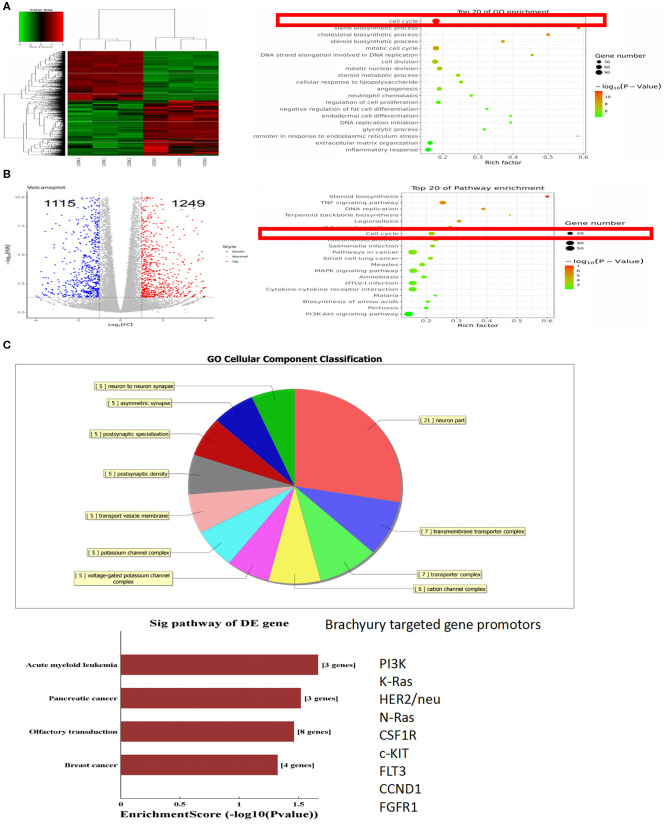
Figure 1.
RNA-sequence and ChIP-sequence analyses of MDA-MB-231 cells. (A) Heat map of differentially expressed transcripts, Gene ontology (GO) analysis, and (B) pathway analysis, based on all identified transcripts. (C) Cellular component classification analysis and targeted genes of ChIP-seq. P-value of GO analysis and enrichment of pathway analysis are listed for each category. P-value of pathway is colored in red (P < 0.05).

