
Figure 10.
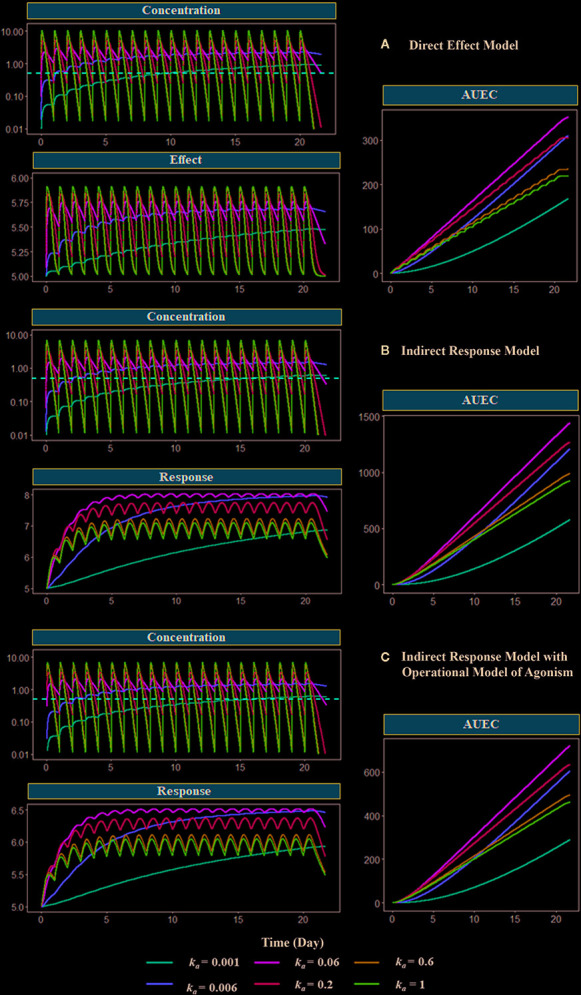
Model-based simulations with different absorption rates. Drug concentration, response (effect), and area under response (AUEC) versus time profiles have been simulated with different PD models: (A) direct response model, (B) indirect model, and (C) indirect response model with operational model of agonism. The dose is 1000 mg. The absorption rate varies from 0.001 to 1 h−1. The red dashed line shows the EC50 values or the A50 values, which are equal to 1 mg/L. Clearance (CL) is 27 L/h, the volume of distribution (V) is 90 L (kel = 0.3 h−1), concentration of receptor complex that triggers the half-maximum effect (K E) is 5 mg/L, Emax is 1, response production rate constant (k in) is 0.1 h−1, response elimination rate constant (k out) is 0.02 h−1, equilibrium dissociate rate (K D) is 2, target production (k syn) are 1 h−1, and degradation (k deg) rate are 0.2 h−1.