
Figure 4.
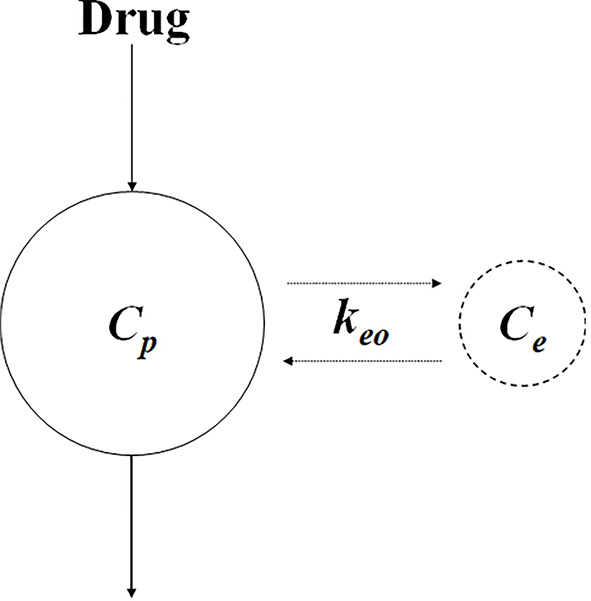
Schematic of biophase model. C e and C p represent the concentration at the biophase and plasma, respectively. k eo represents the first-order distribution rate constant.
Official websites use .gov
A
.gov website belongs to an official
government organization in the United States.
Secure .gov websites use HTTPS
A lock (
) or https:// means you've safely
connected to the .gov website. Share sensitive
information only on official, secure websites.
Schematic of biophase model. C e and C p represent the concentration at the biophase and plasma, respectively. k eo represents the first-order distribution rate constant.