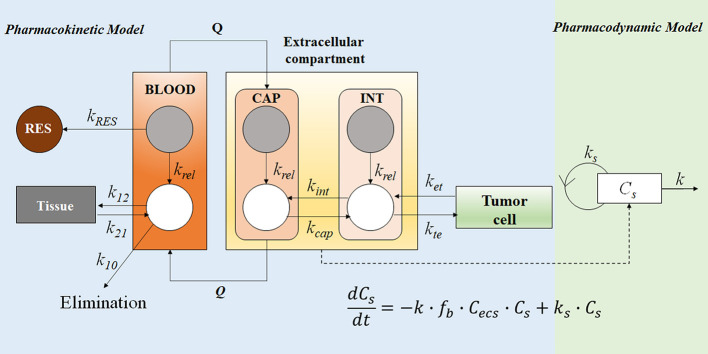
Figure 7.
The PK-PD model of the free doxorubicin and liposomal doxorubicin. Free doxorubicin and liposomal doxorubicin are represented by white and grey circles, respectively; the disposition of free doxorubicin and liposomal doxorubicin was described by a two-compartment and a one-compartment model, respectively. The intra-tumor disposition is described by a physiological model linked with tumor blood flow rate (Q). Tumor tissue was divided into three compartments: capillary (CAP), interstitial (INT), and tumor cell. The former two are considered in the extracellular compartment (ESC). kRES represents reticuloendothelial system (RES) mediated elimination rate constant of liposomal doxorubicin; liposomal doxorubicin was unidirectionally transported from CAP into INT (k tu); k rel represents the first-order release rate constant of free doxorubicin from liposomes in blood, CAP and INT; distribution of free doxorubicin to tumor cells was described using kte and k et; k 21, k 12, and k 10 represent the micro-pharmacokinetic constants for free doxorubicin. For the pharmacodynamic model, a cell-kill kinetic model was linked with the PK model. The mass balance equation describes the change rate of cell number, where Cs represents cell number, f b ∙C ecs represents the unbound drug concentration in ESC, ks is the cell proliferation rate constant, and k is the drug-induced irreversible cell-death rate constant.

