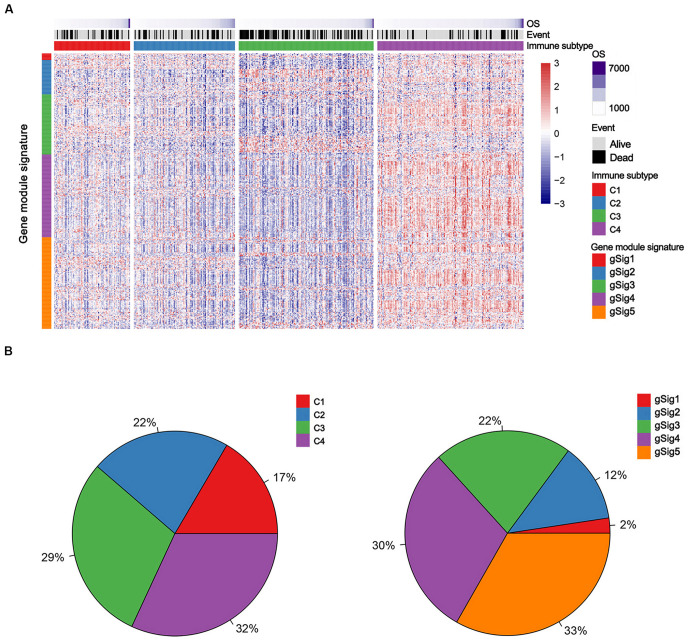
FIGURE 1.
The immune subtypes and gene module signatures in the TCGA LUAD cohort. (A) Columns and rows represent patients and genes, respectively. Patients (TCGA dataset, n = 489) are arranged based on their immune subtypes and genes are ordered based on the gene module signatures. OS and survival events are annotated for each patient. (B) The distribution of immune subtypes and gene module signatures in the TCGA cohort. C1, Cluster 1; C2, Cluster 2; C3, Cluster 3; C4, Cluster 4.

